

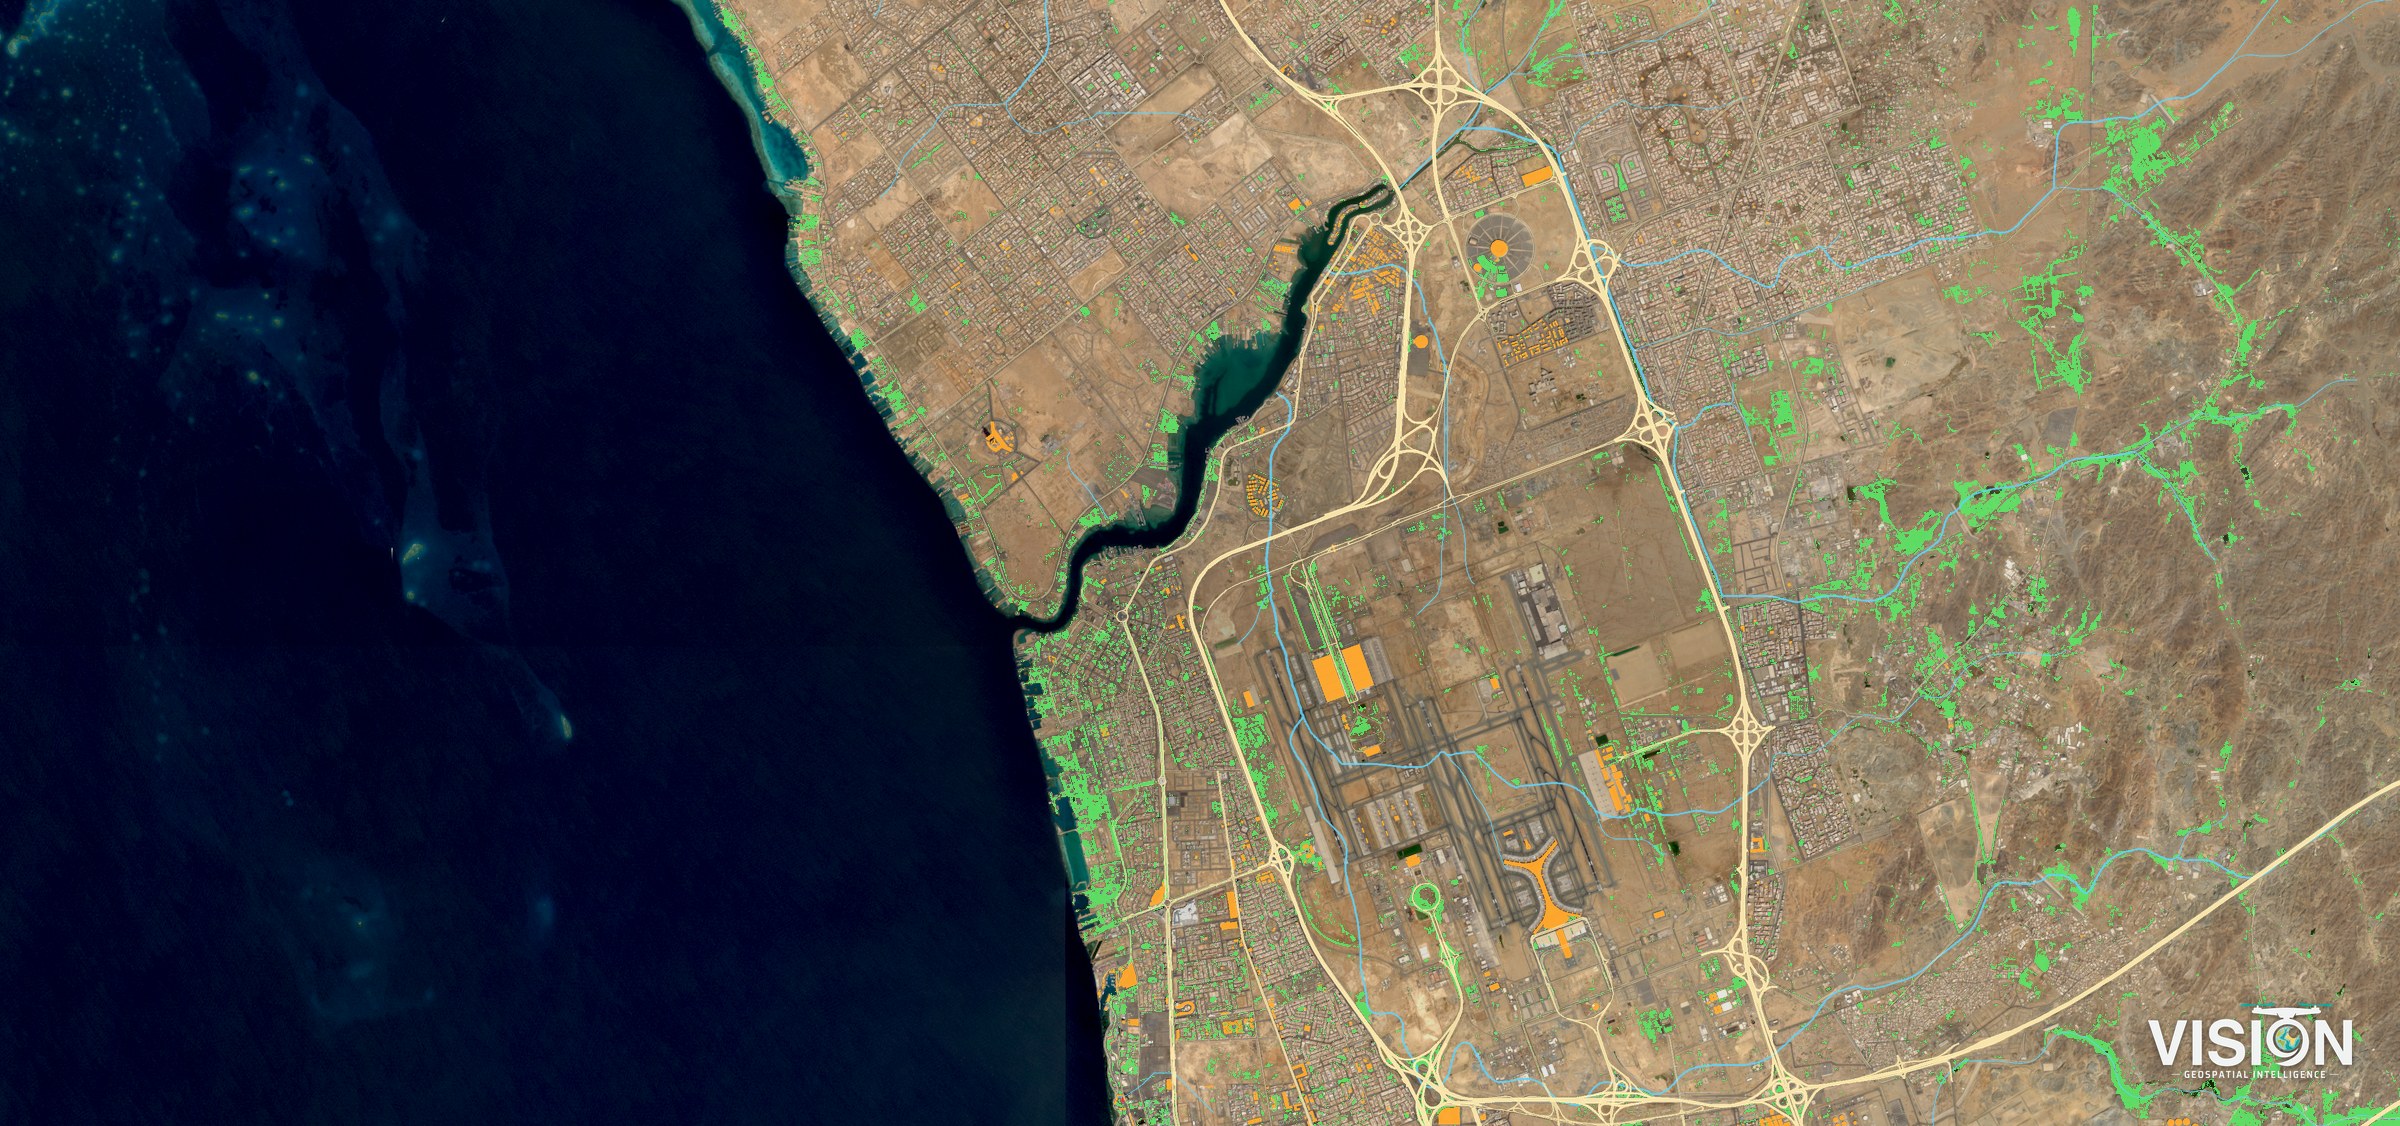
Geospatial analysis and GIS
We analyze terrain, drainage, land and assets from our survey data and your records, and deliver maps and findings for planning and asset management.
- Deliverables
- Geodatabase (GDB, GPKG), layers (SHP), maps (PDF), web maps on request
- Equipment and software
- GIS and spatial analysis software, geodatabases, and our own survey data
Our GIS work
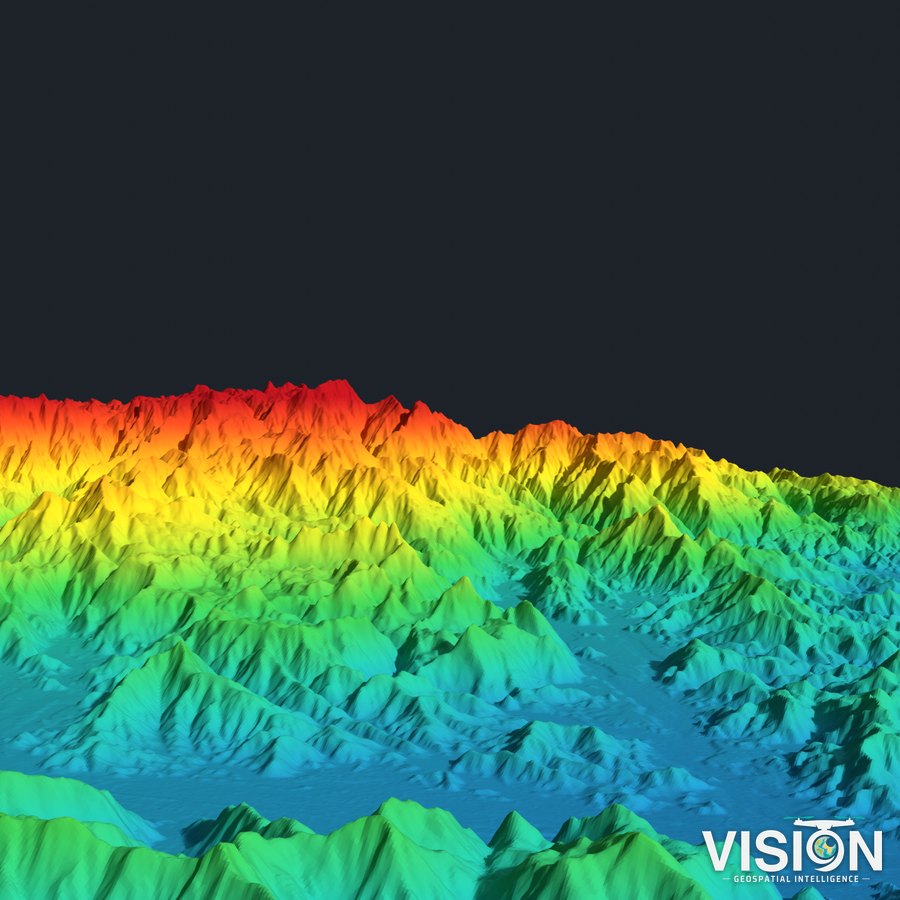 3D terrain model
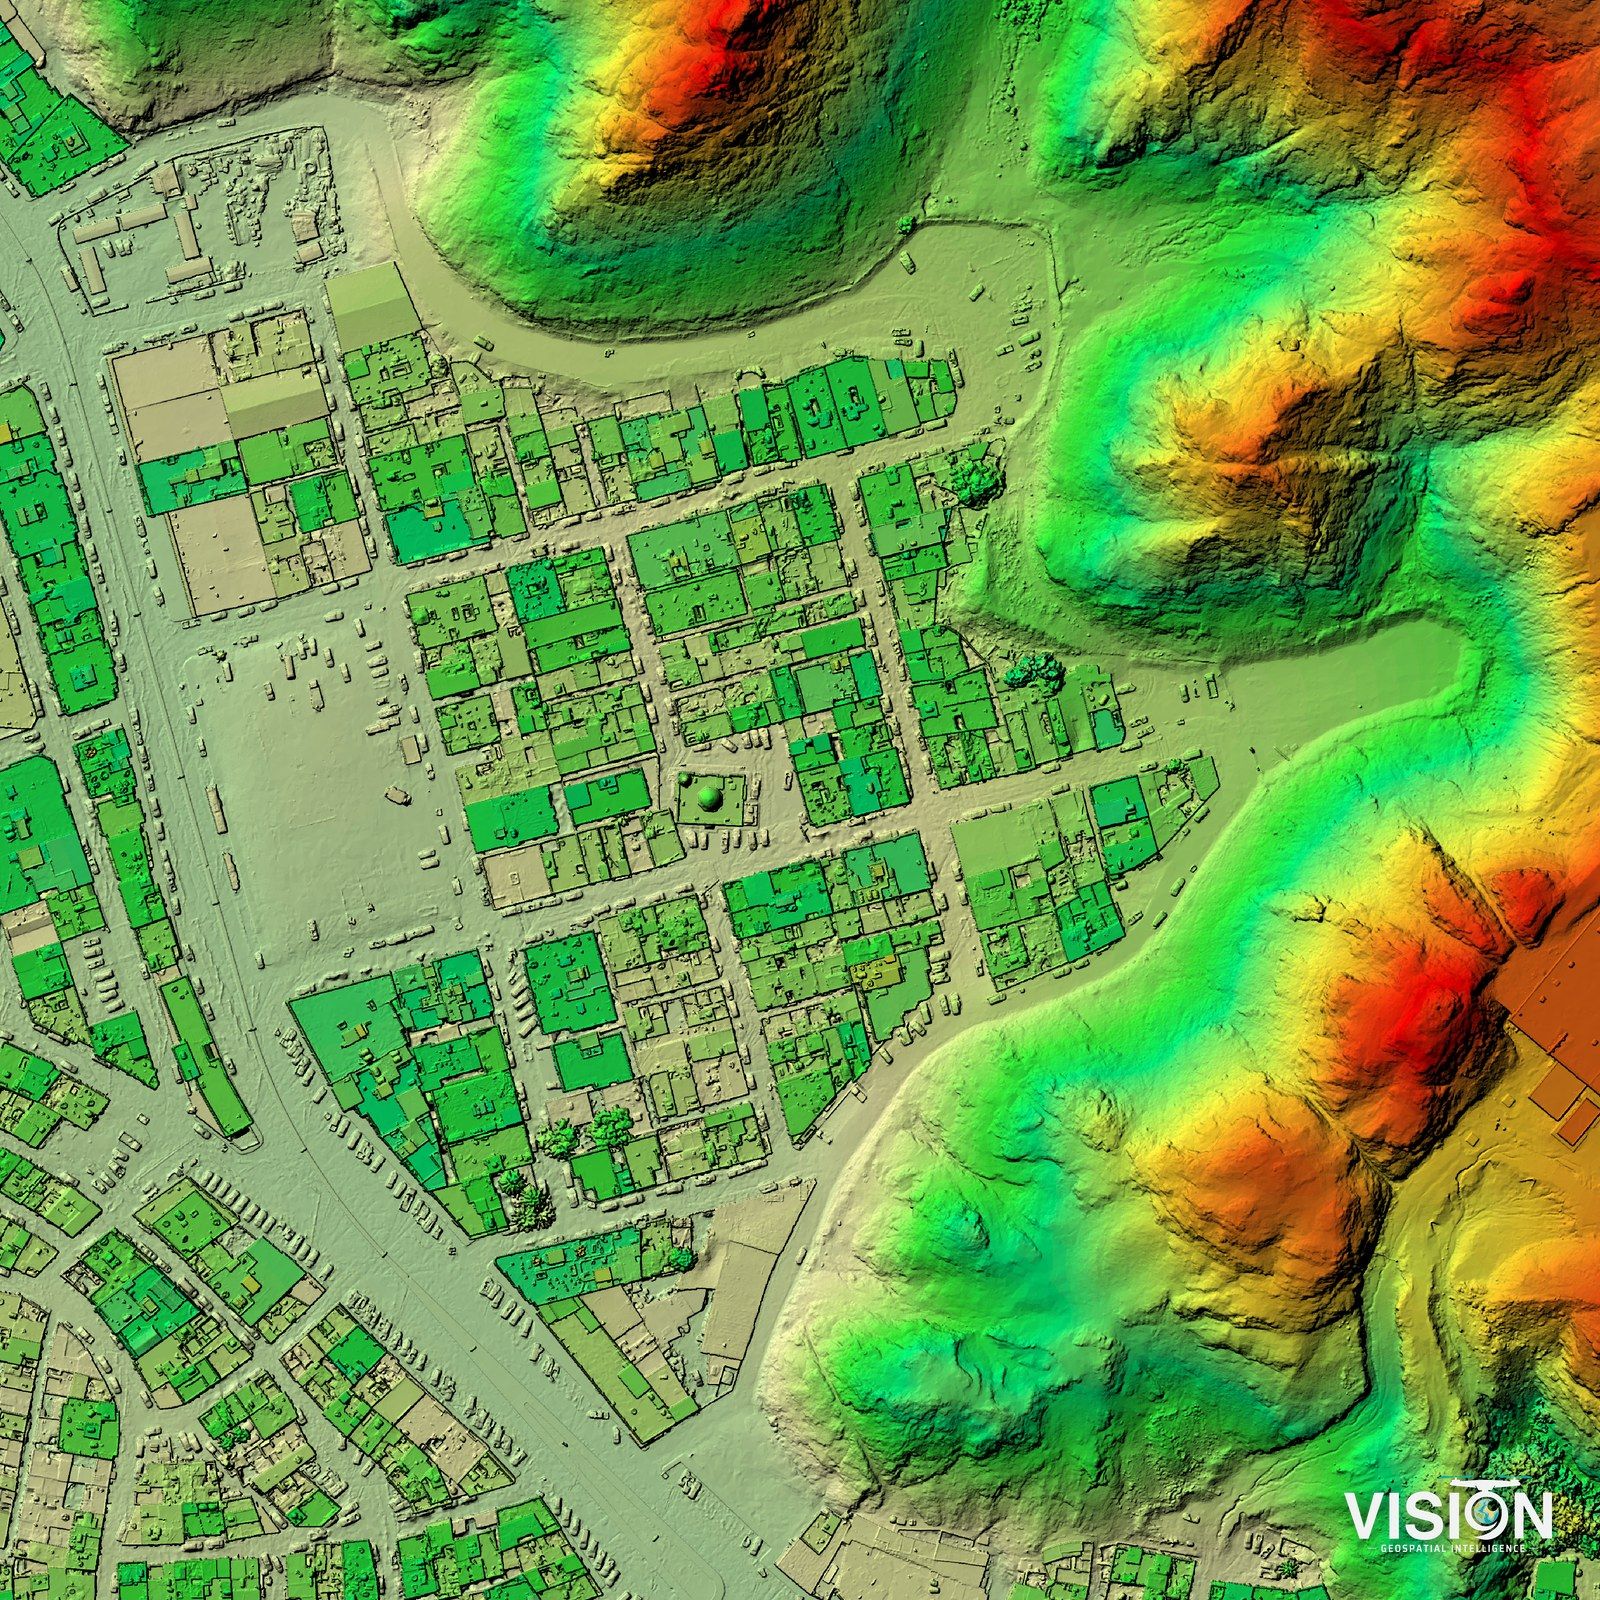
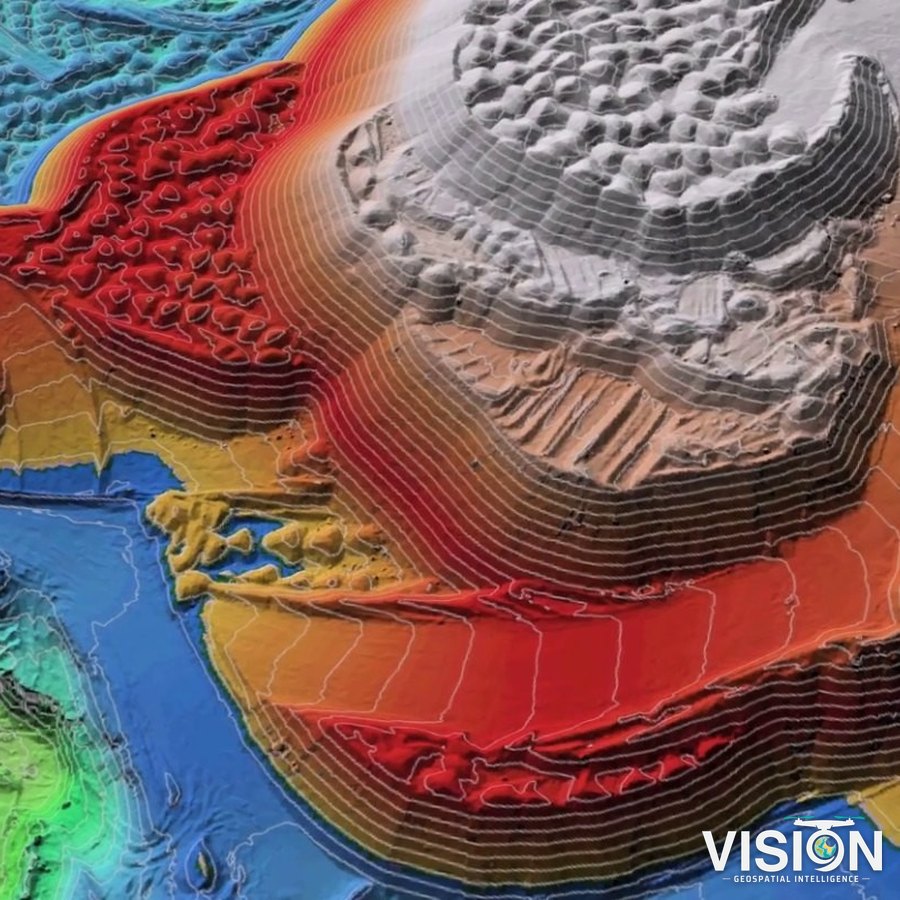 Digital surface model
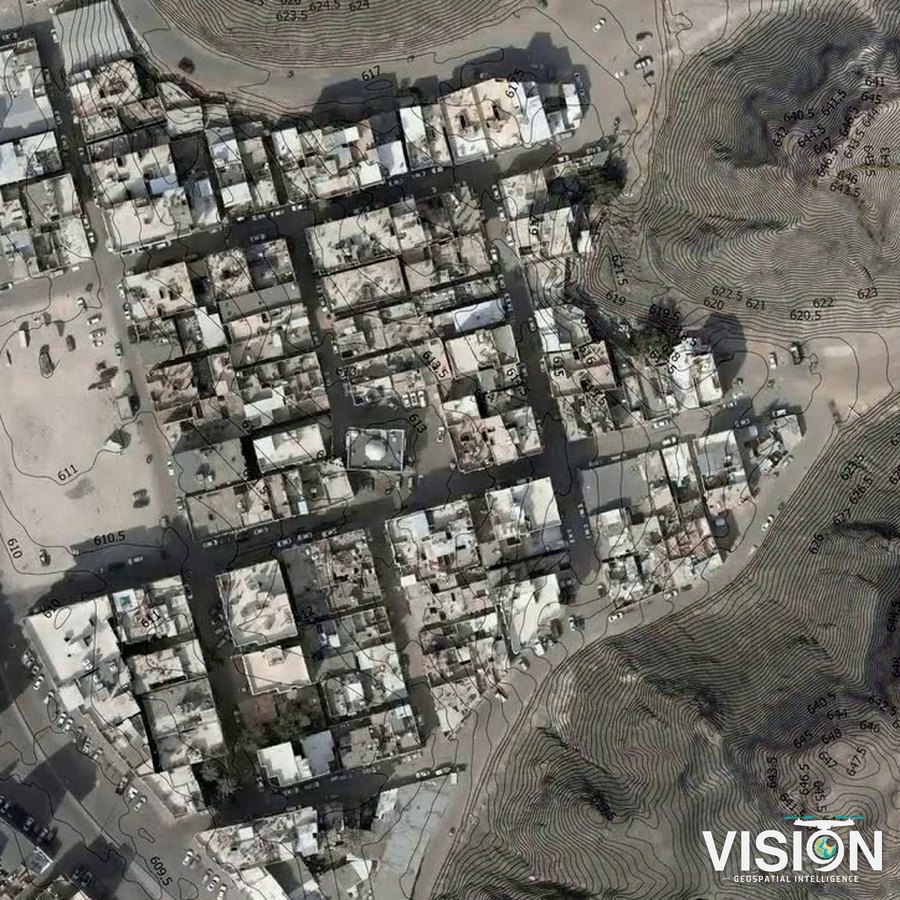 Drone orthophoto
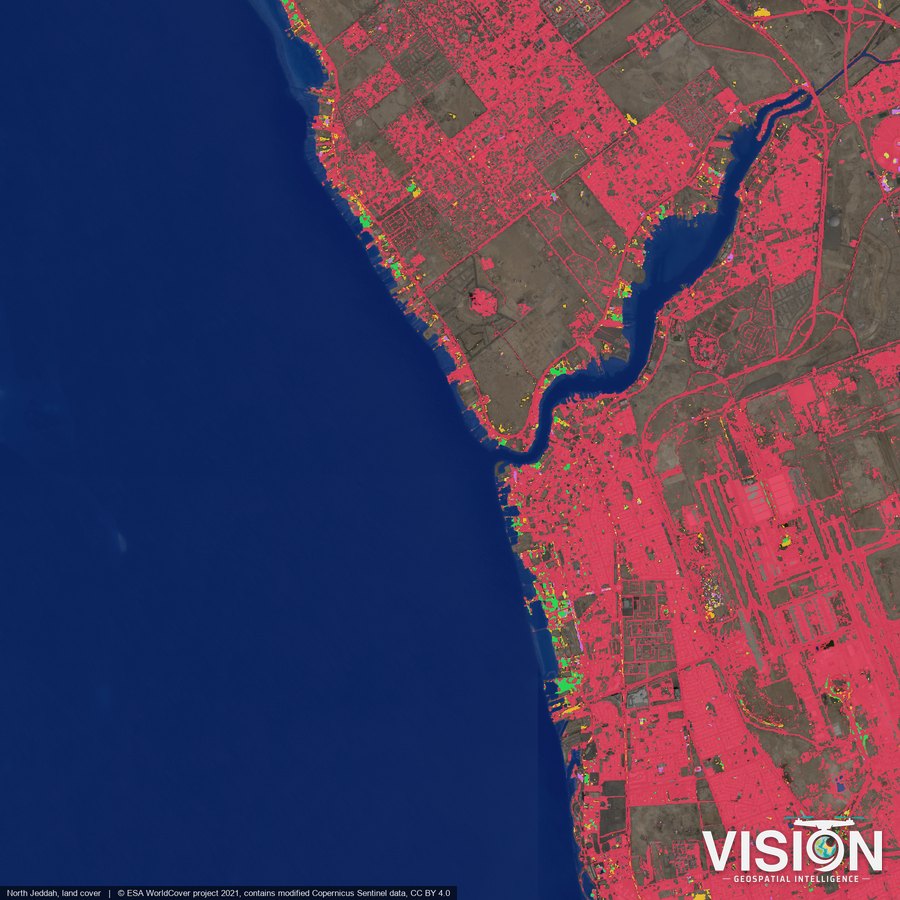 Land cover
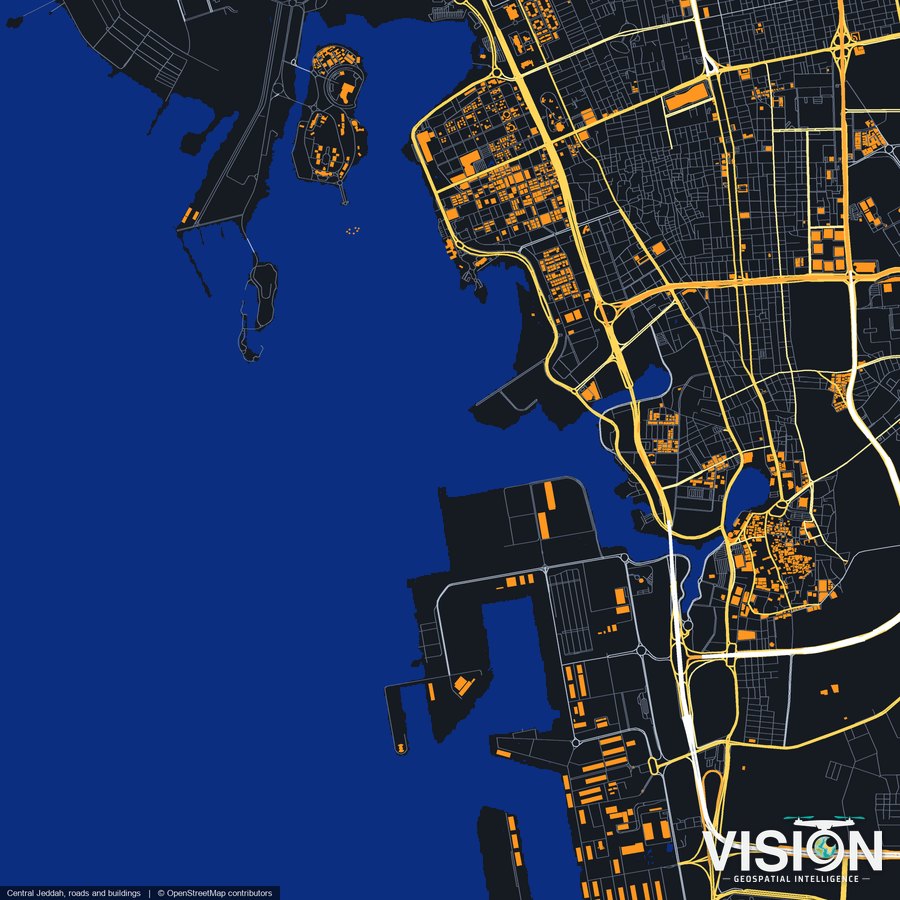 Roads and buildings
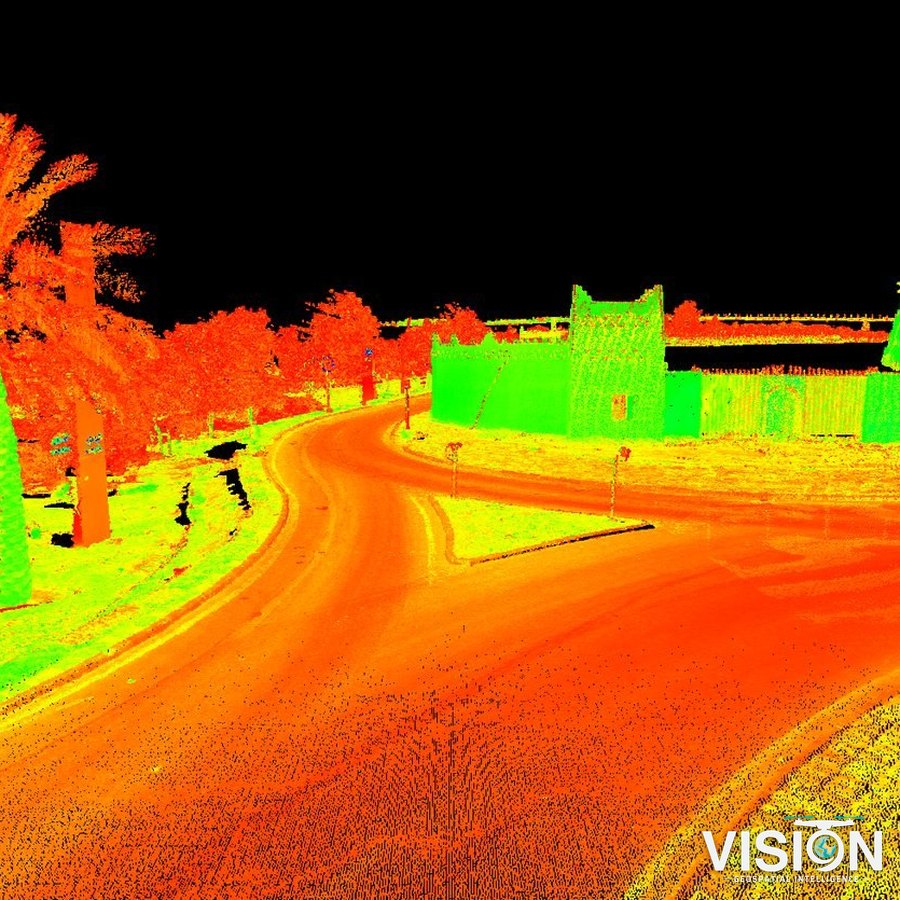 Road point cloud
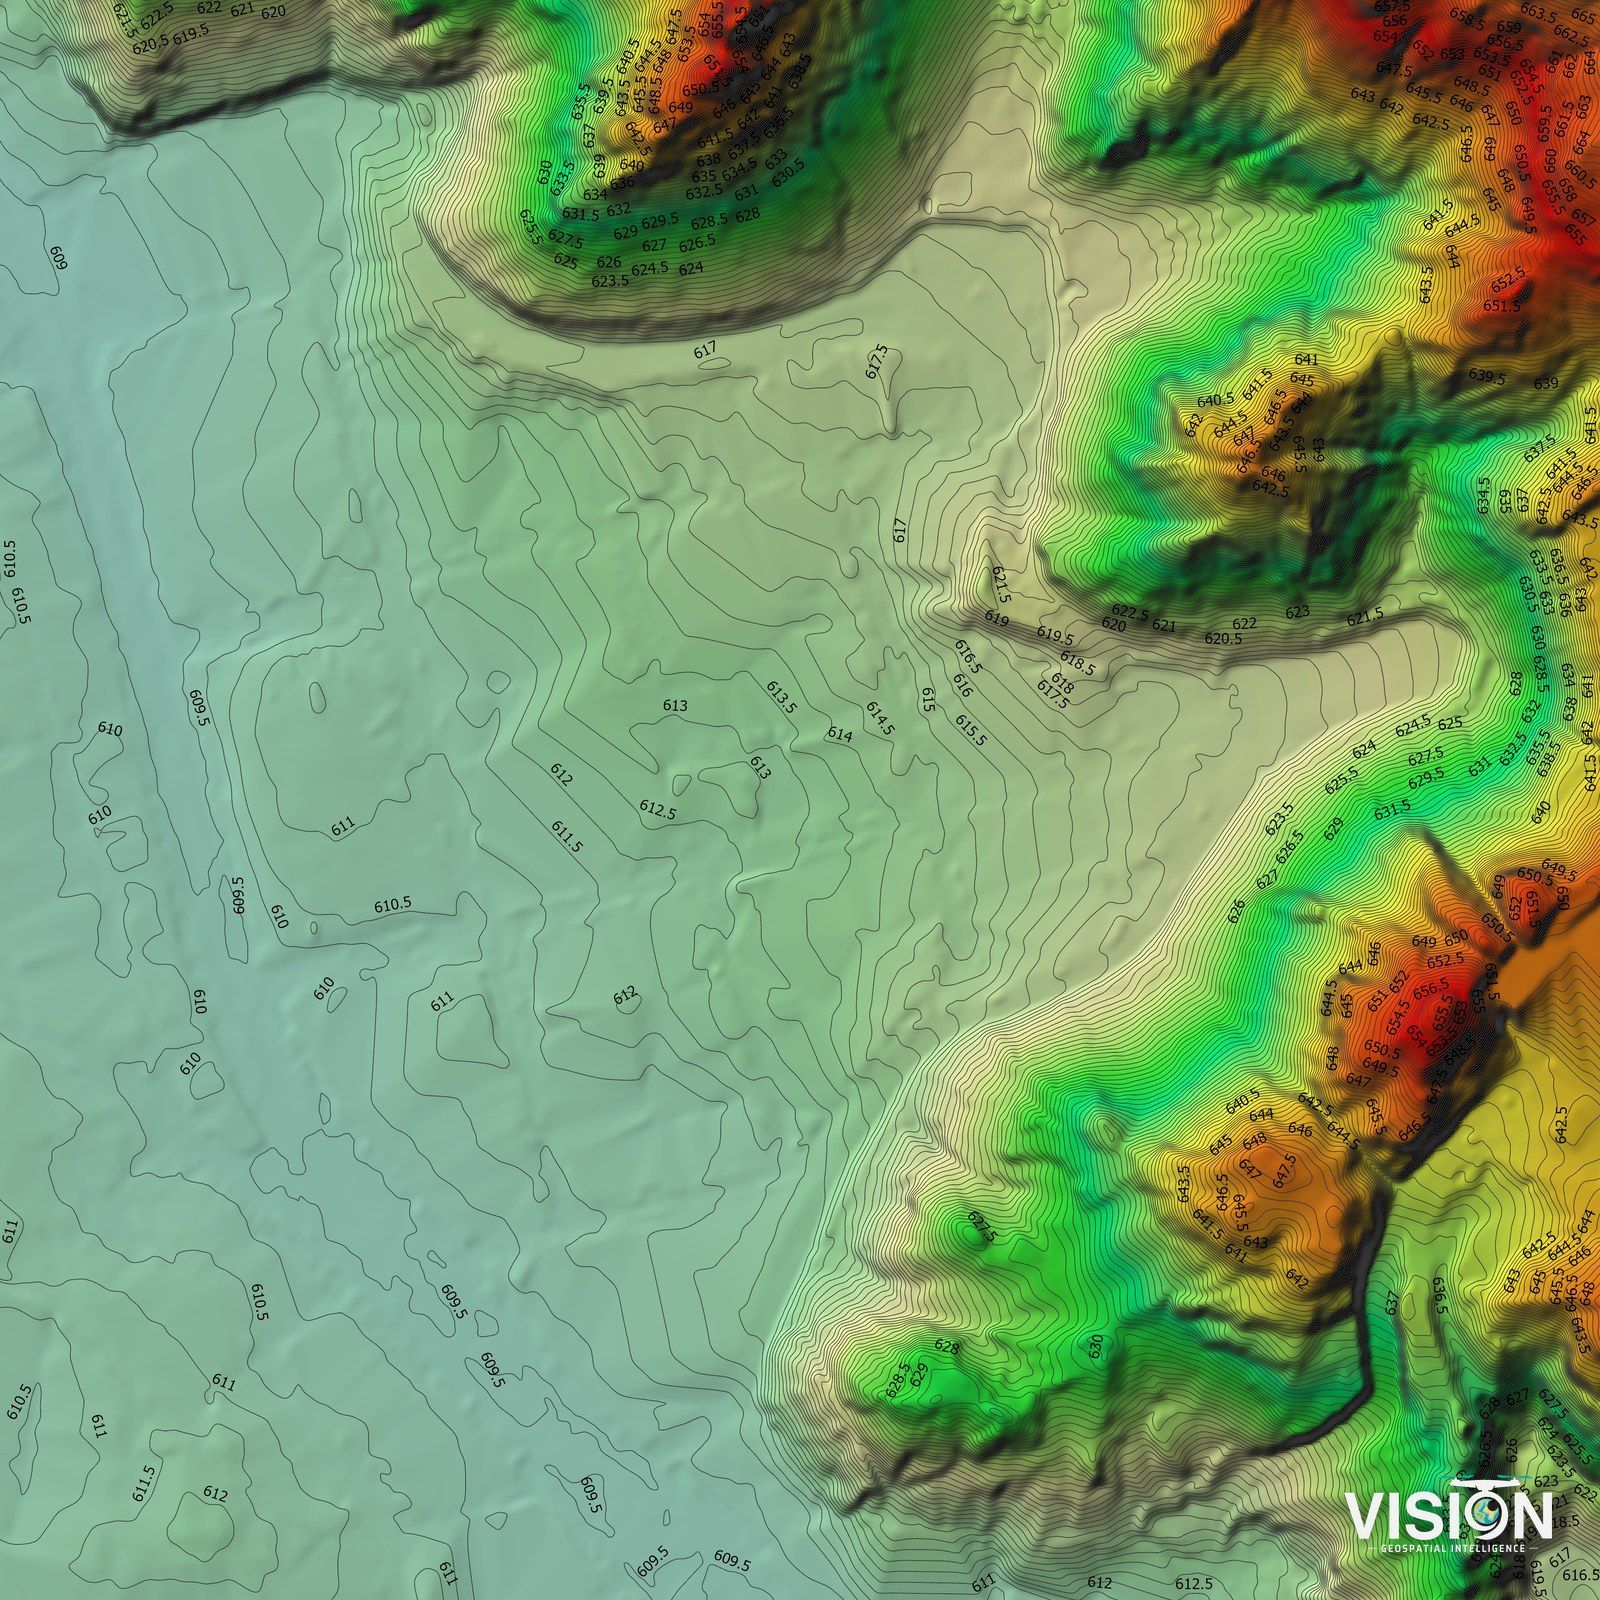
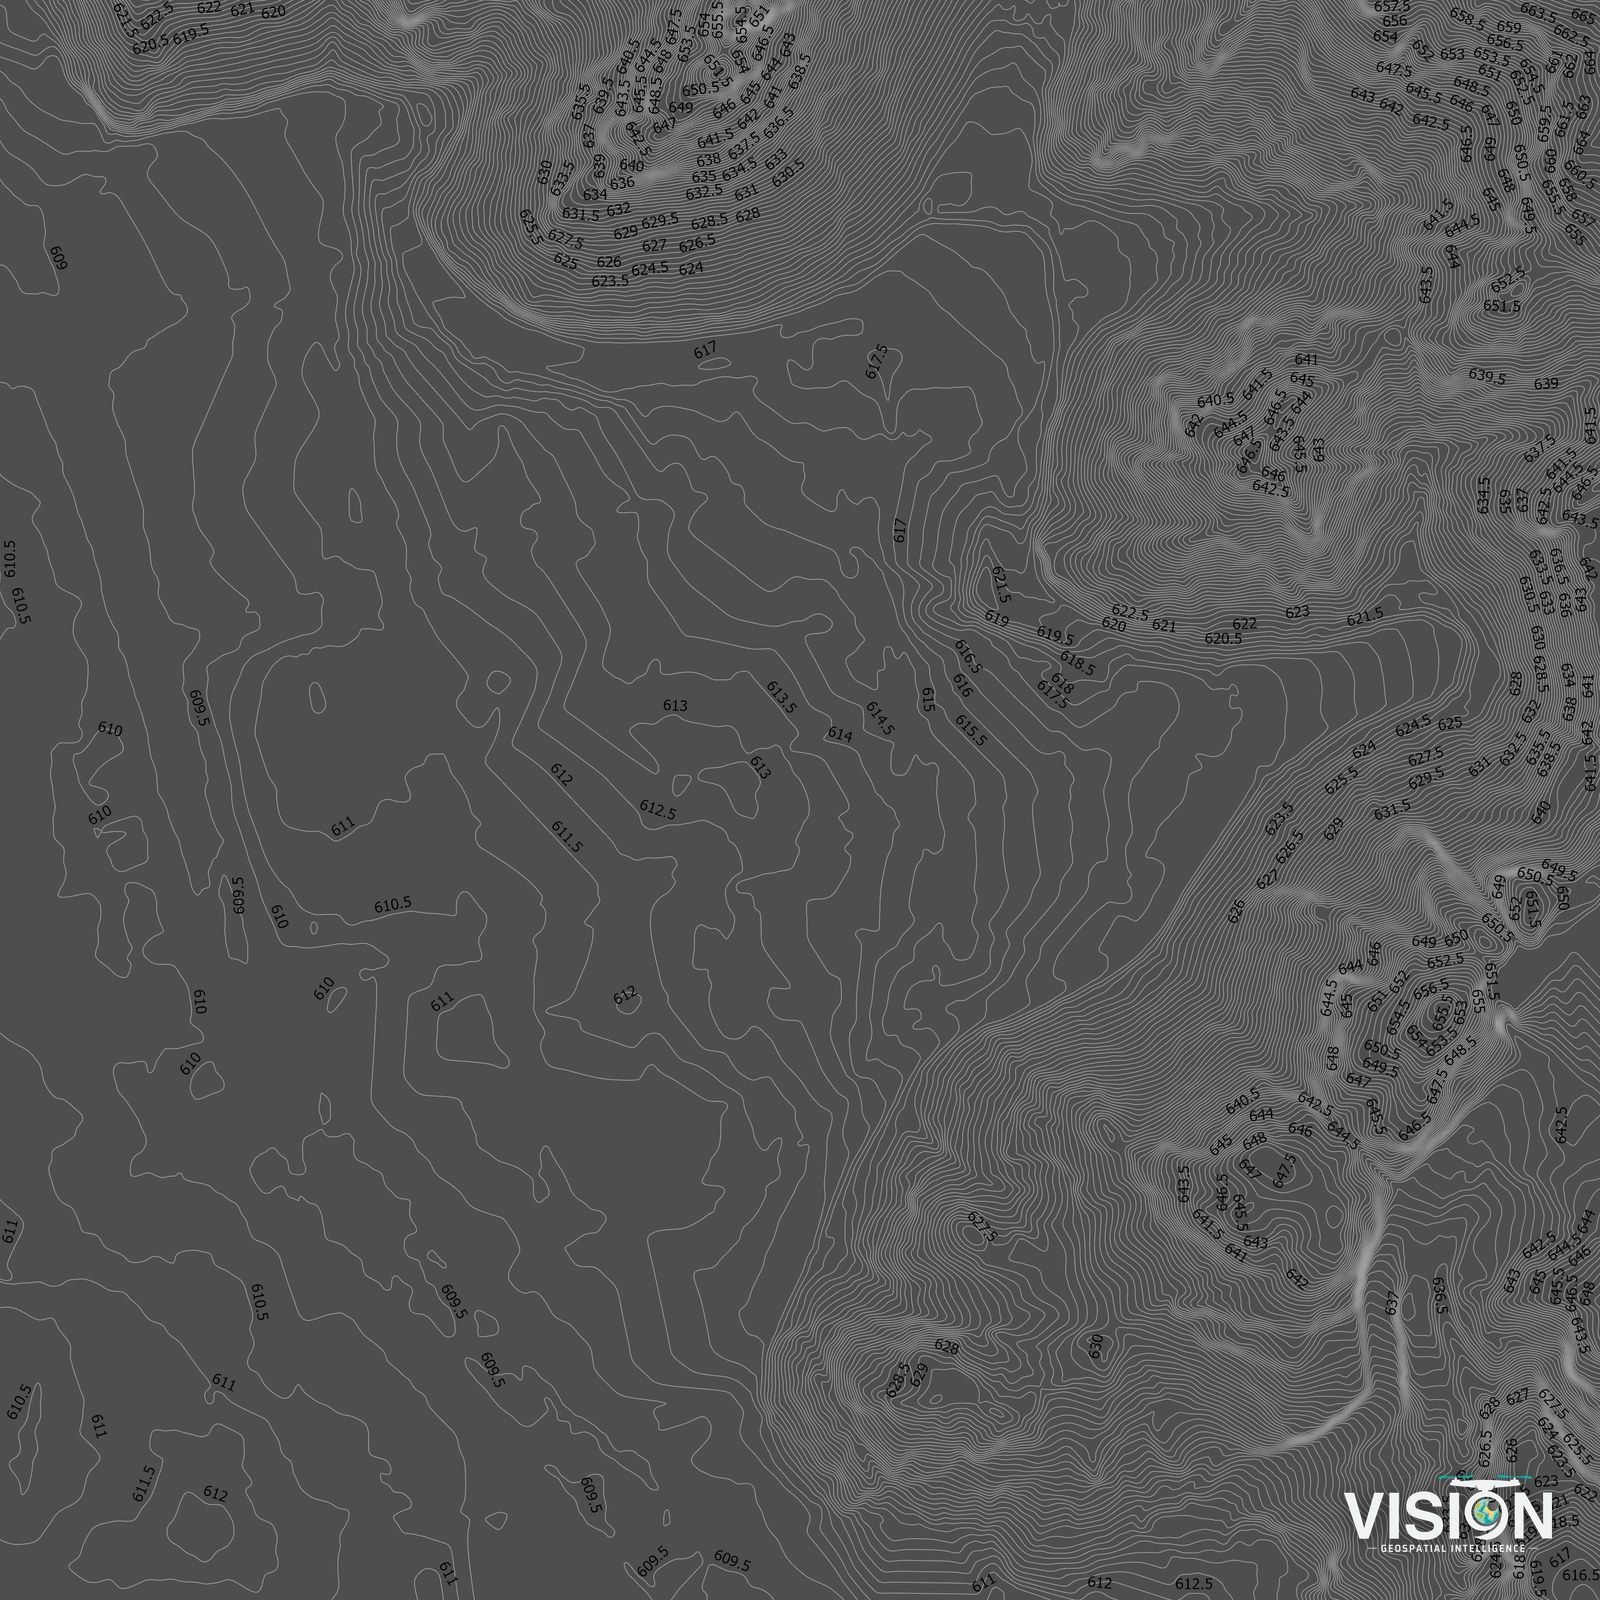
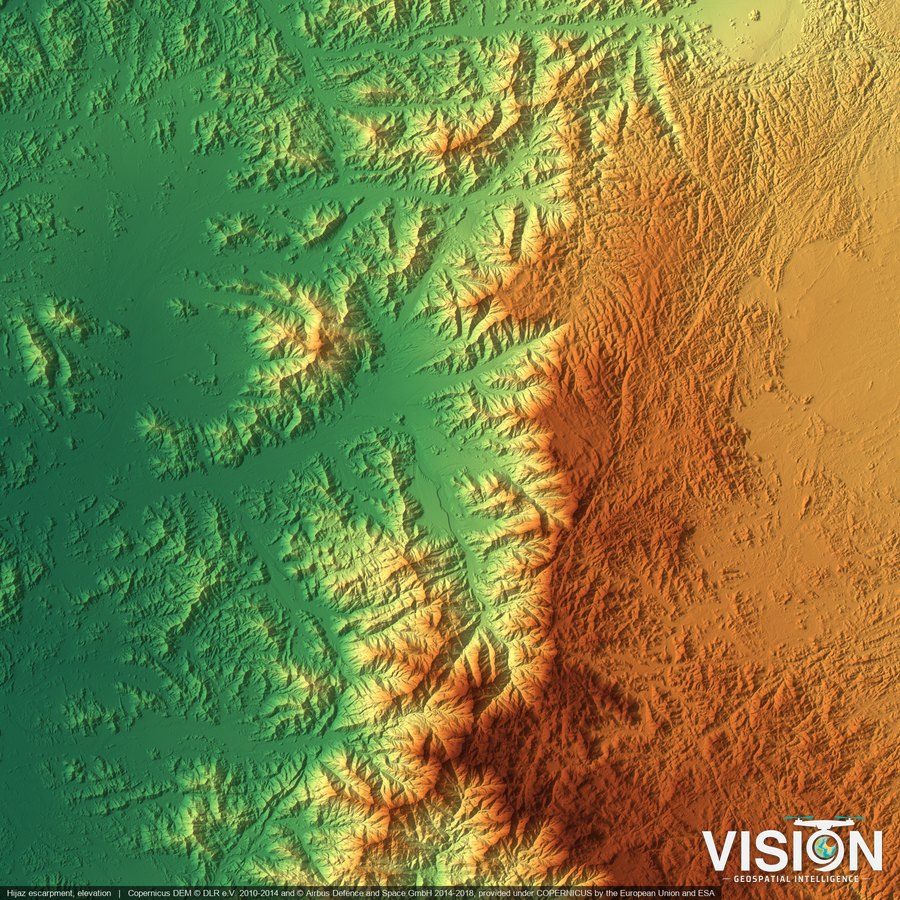 Digital elevation
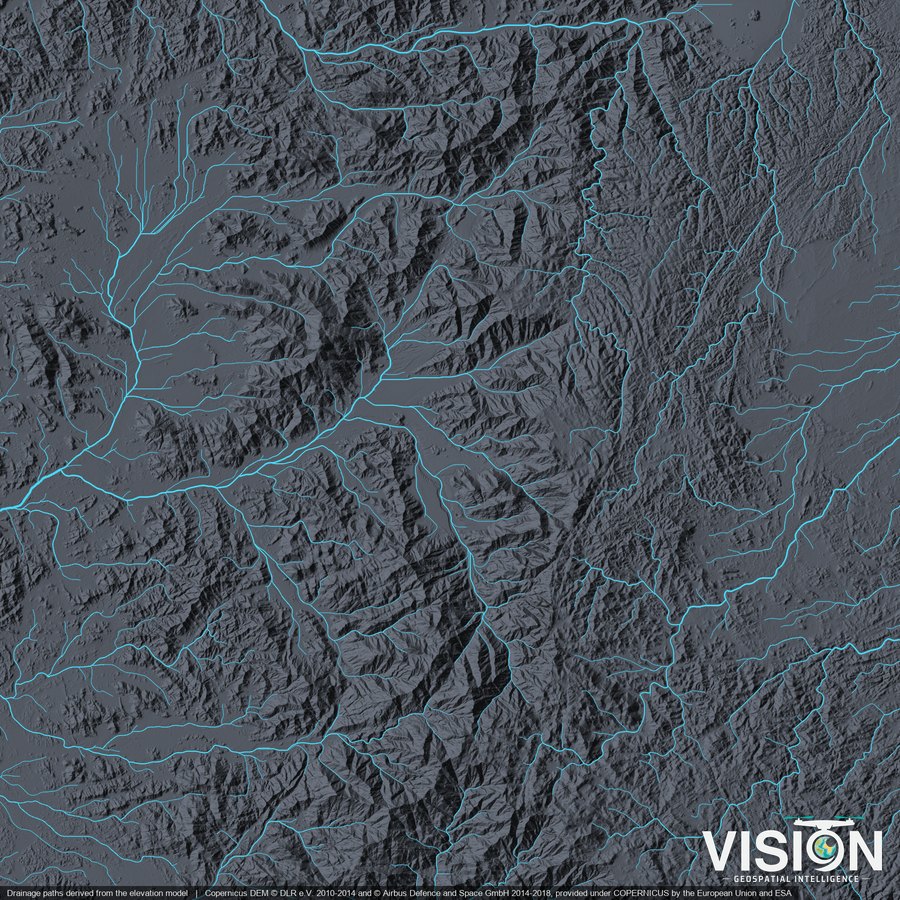 Drainage paths
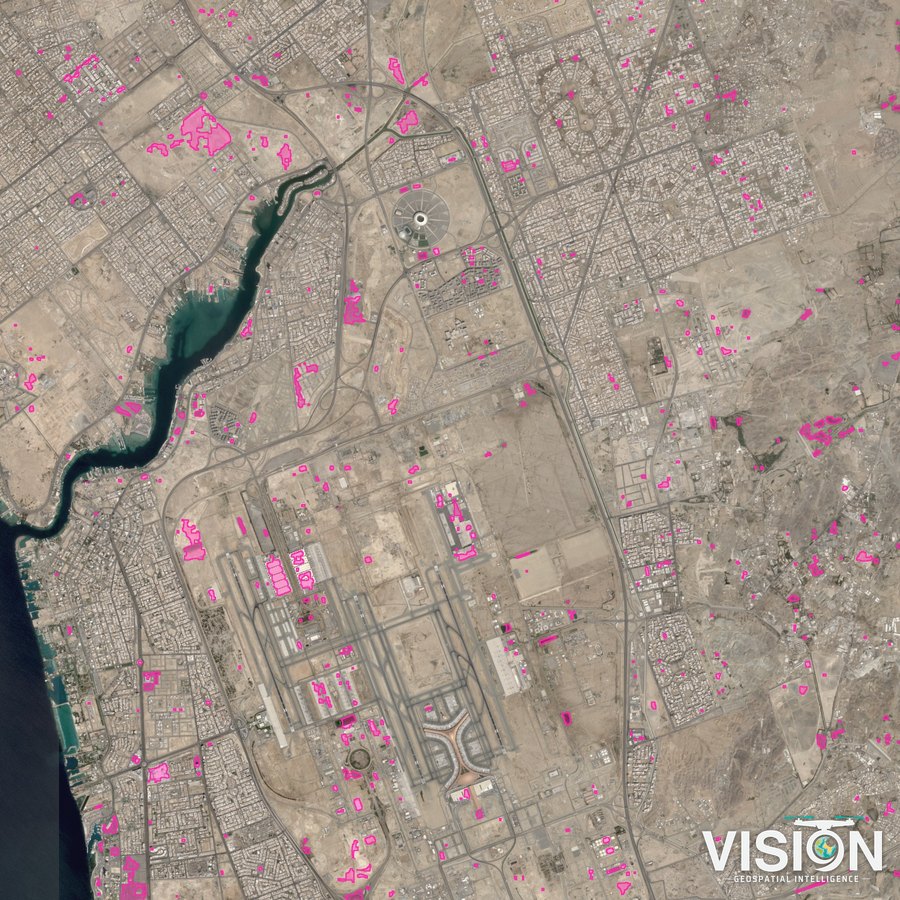 Change detection
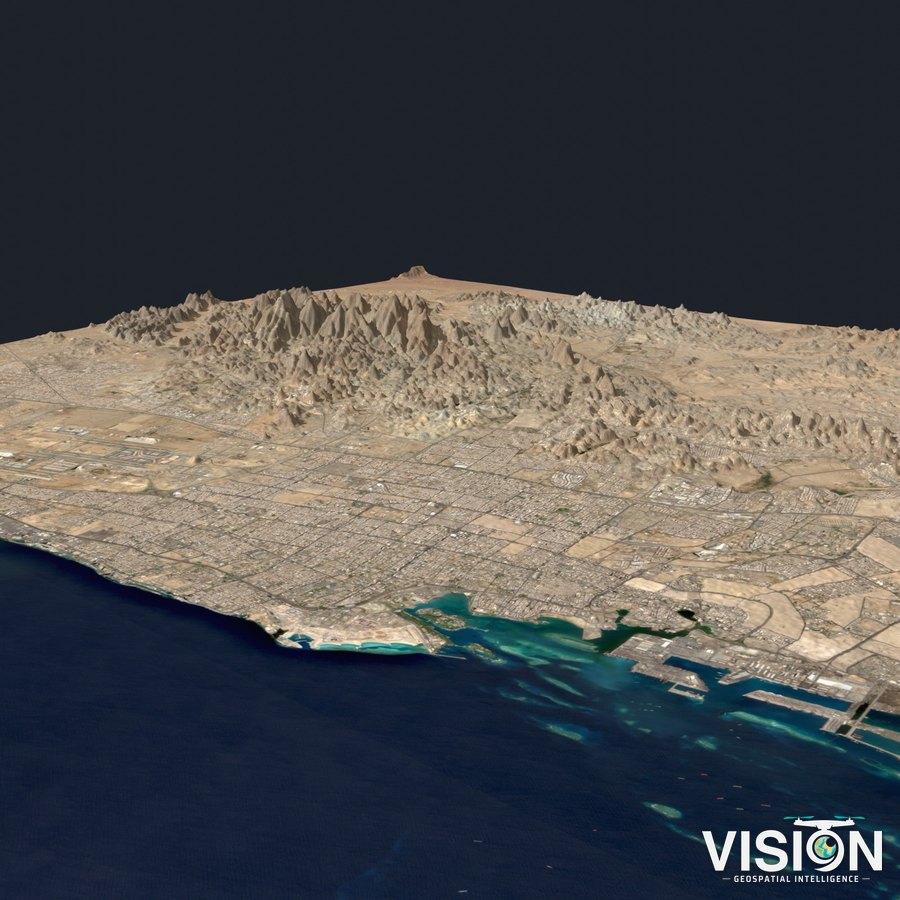 Satellite image over terrain
Spatial data layers
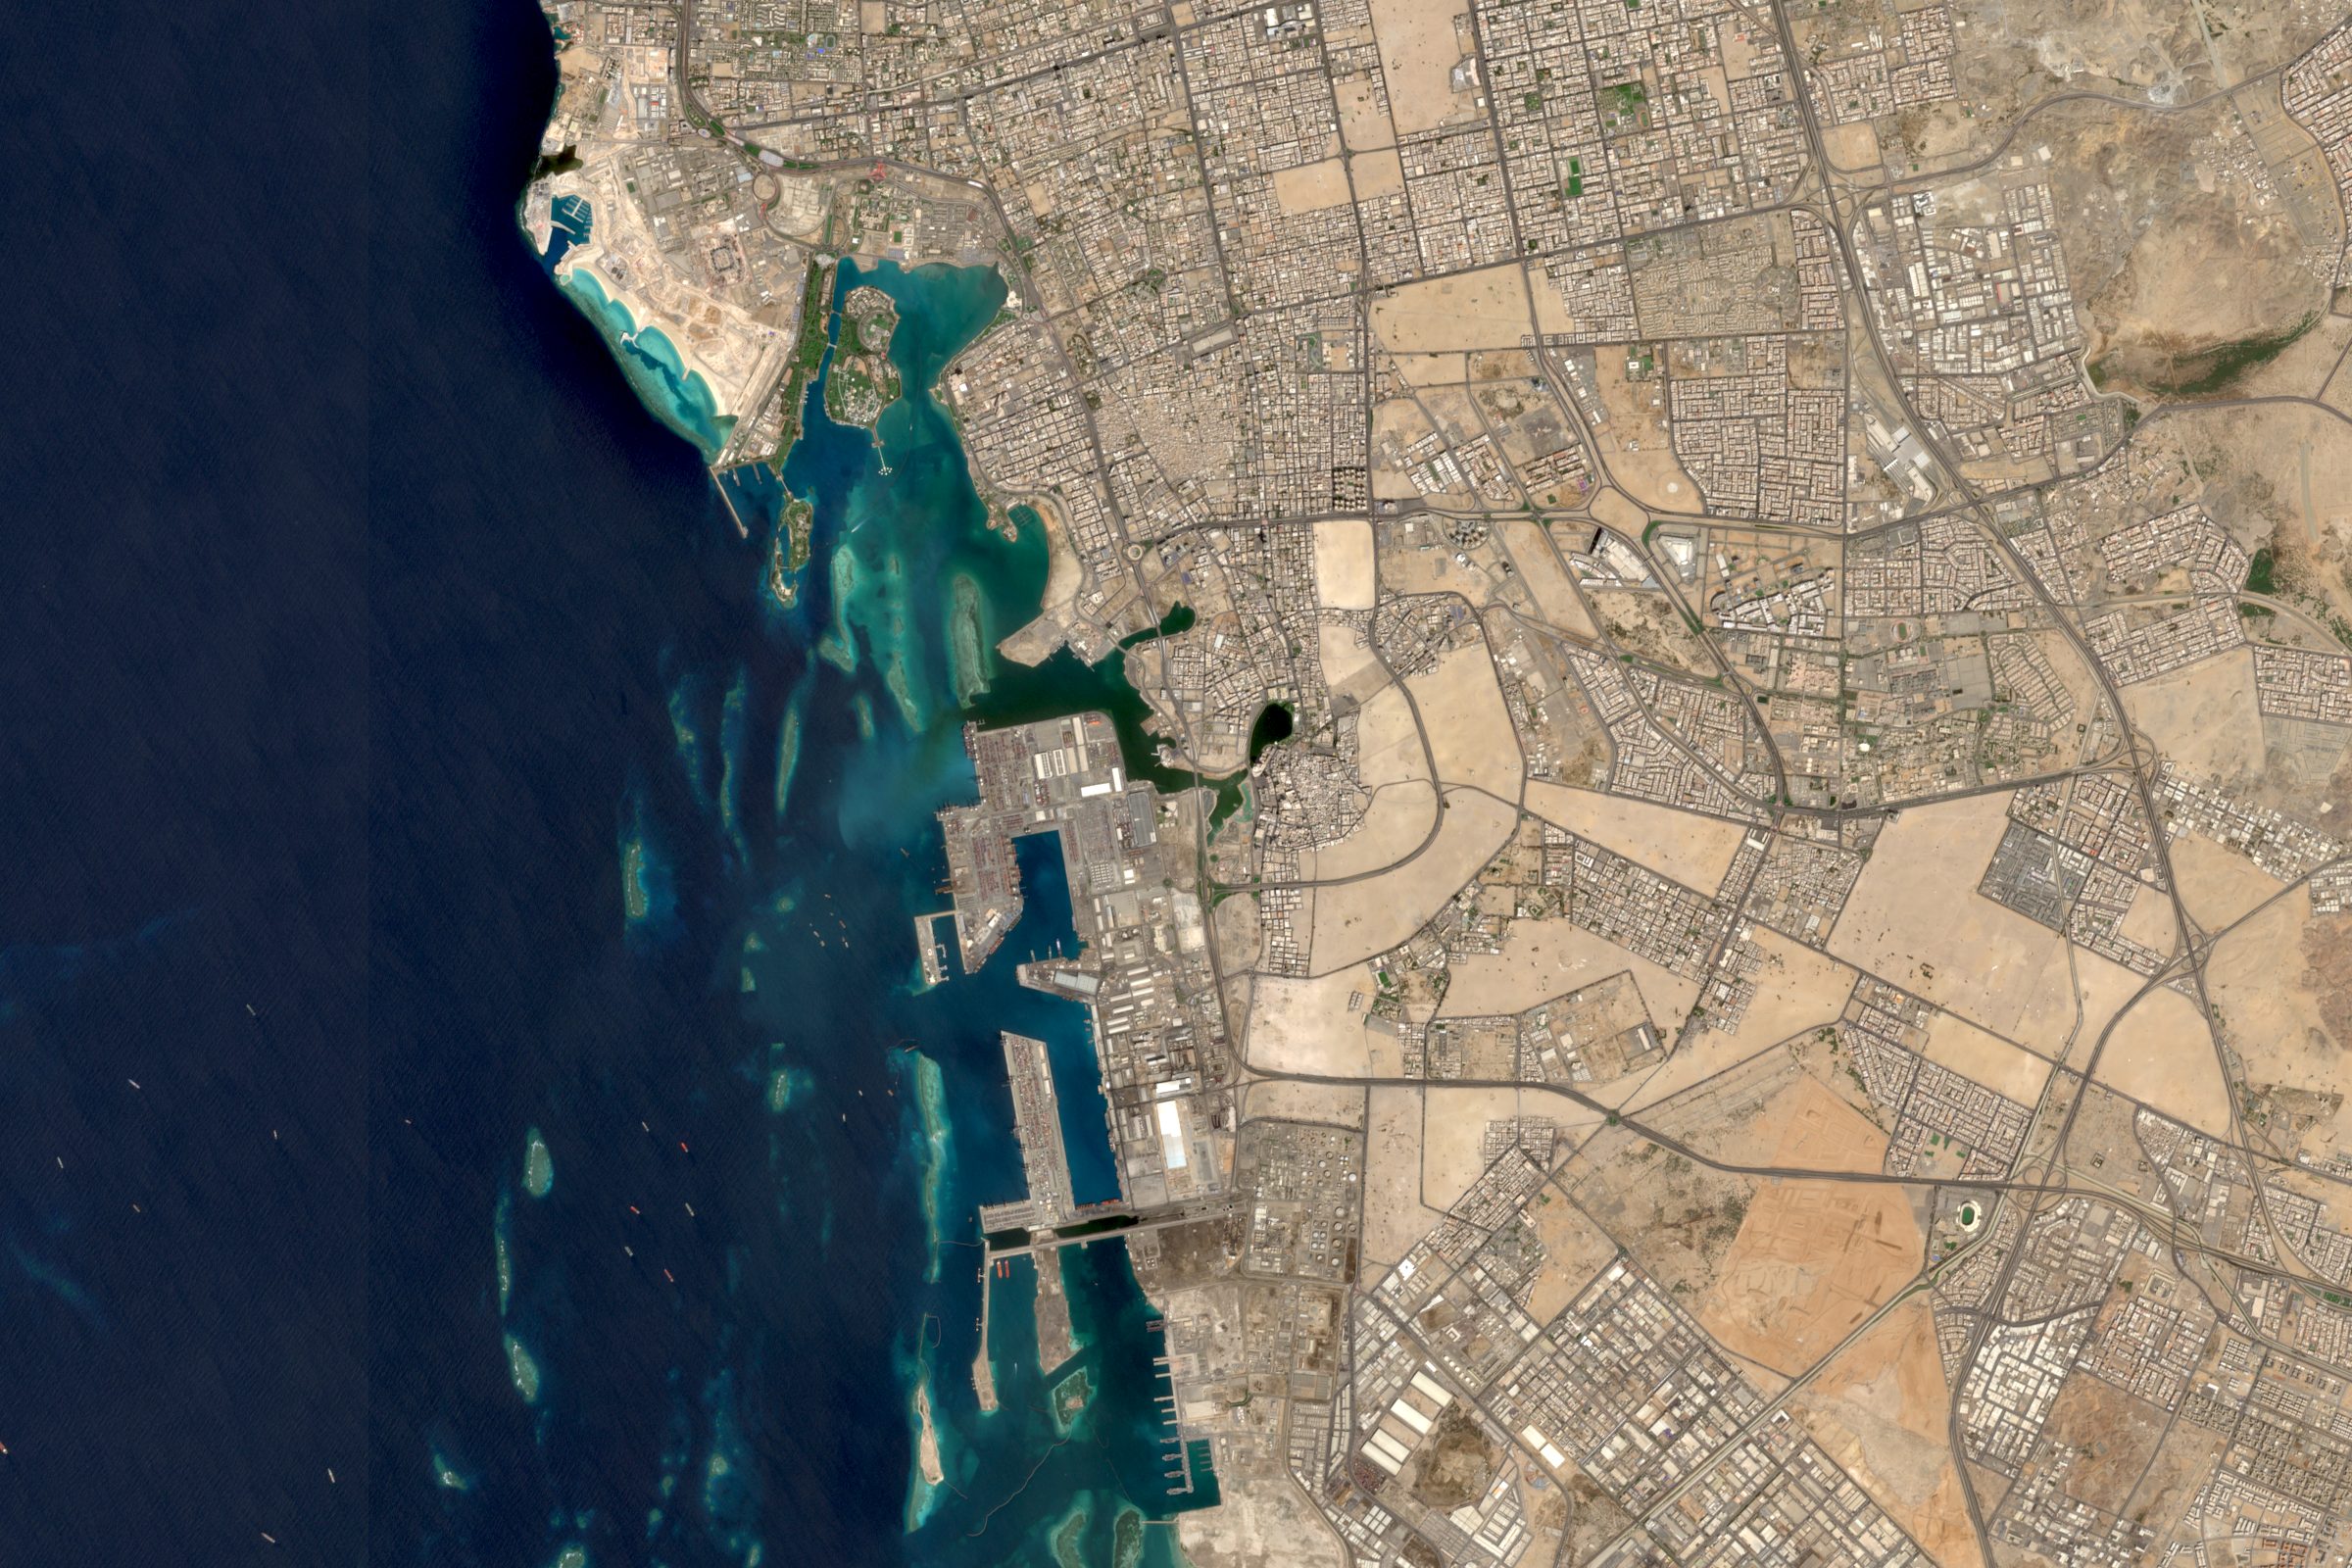
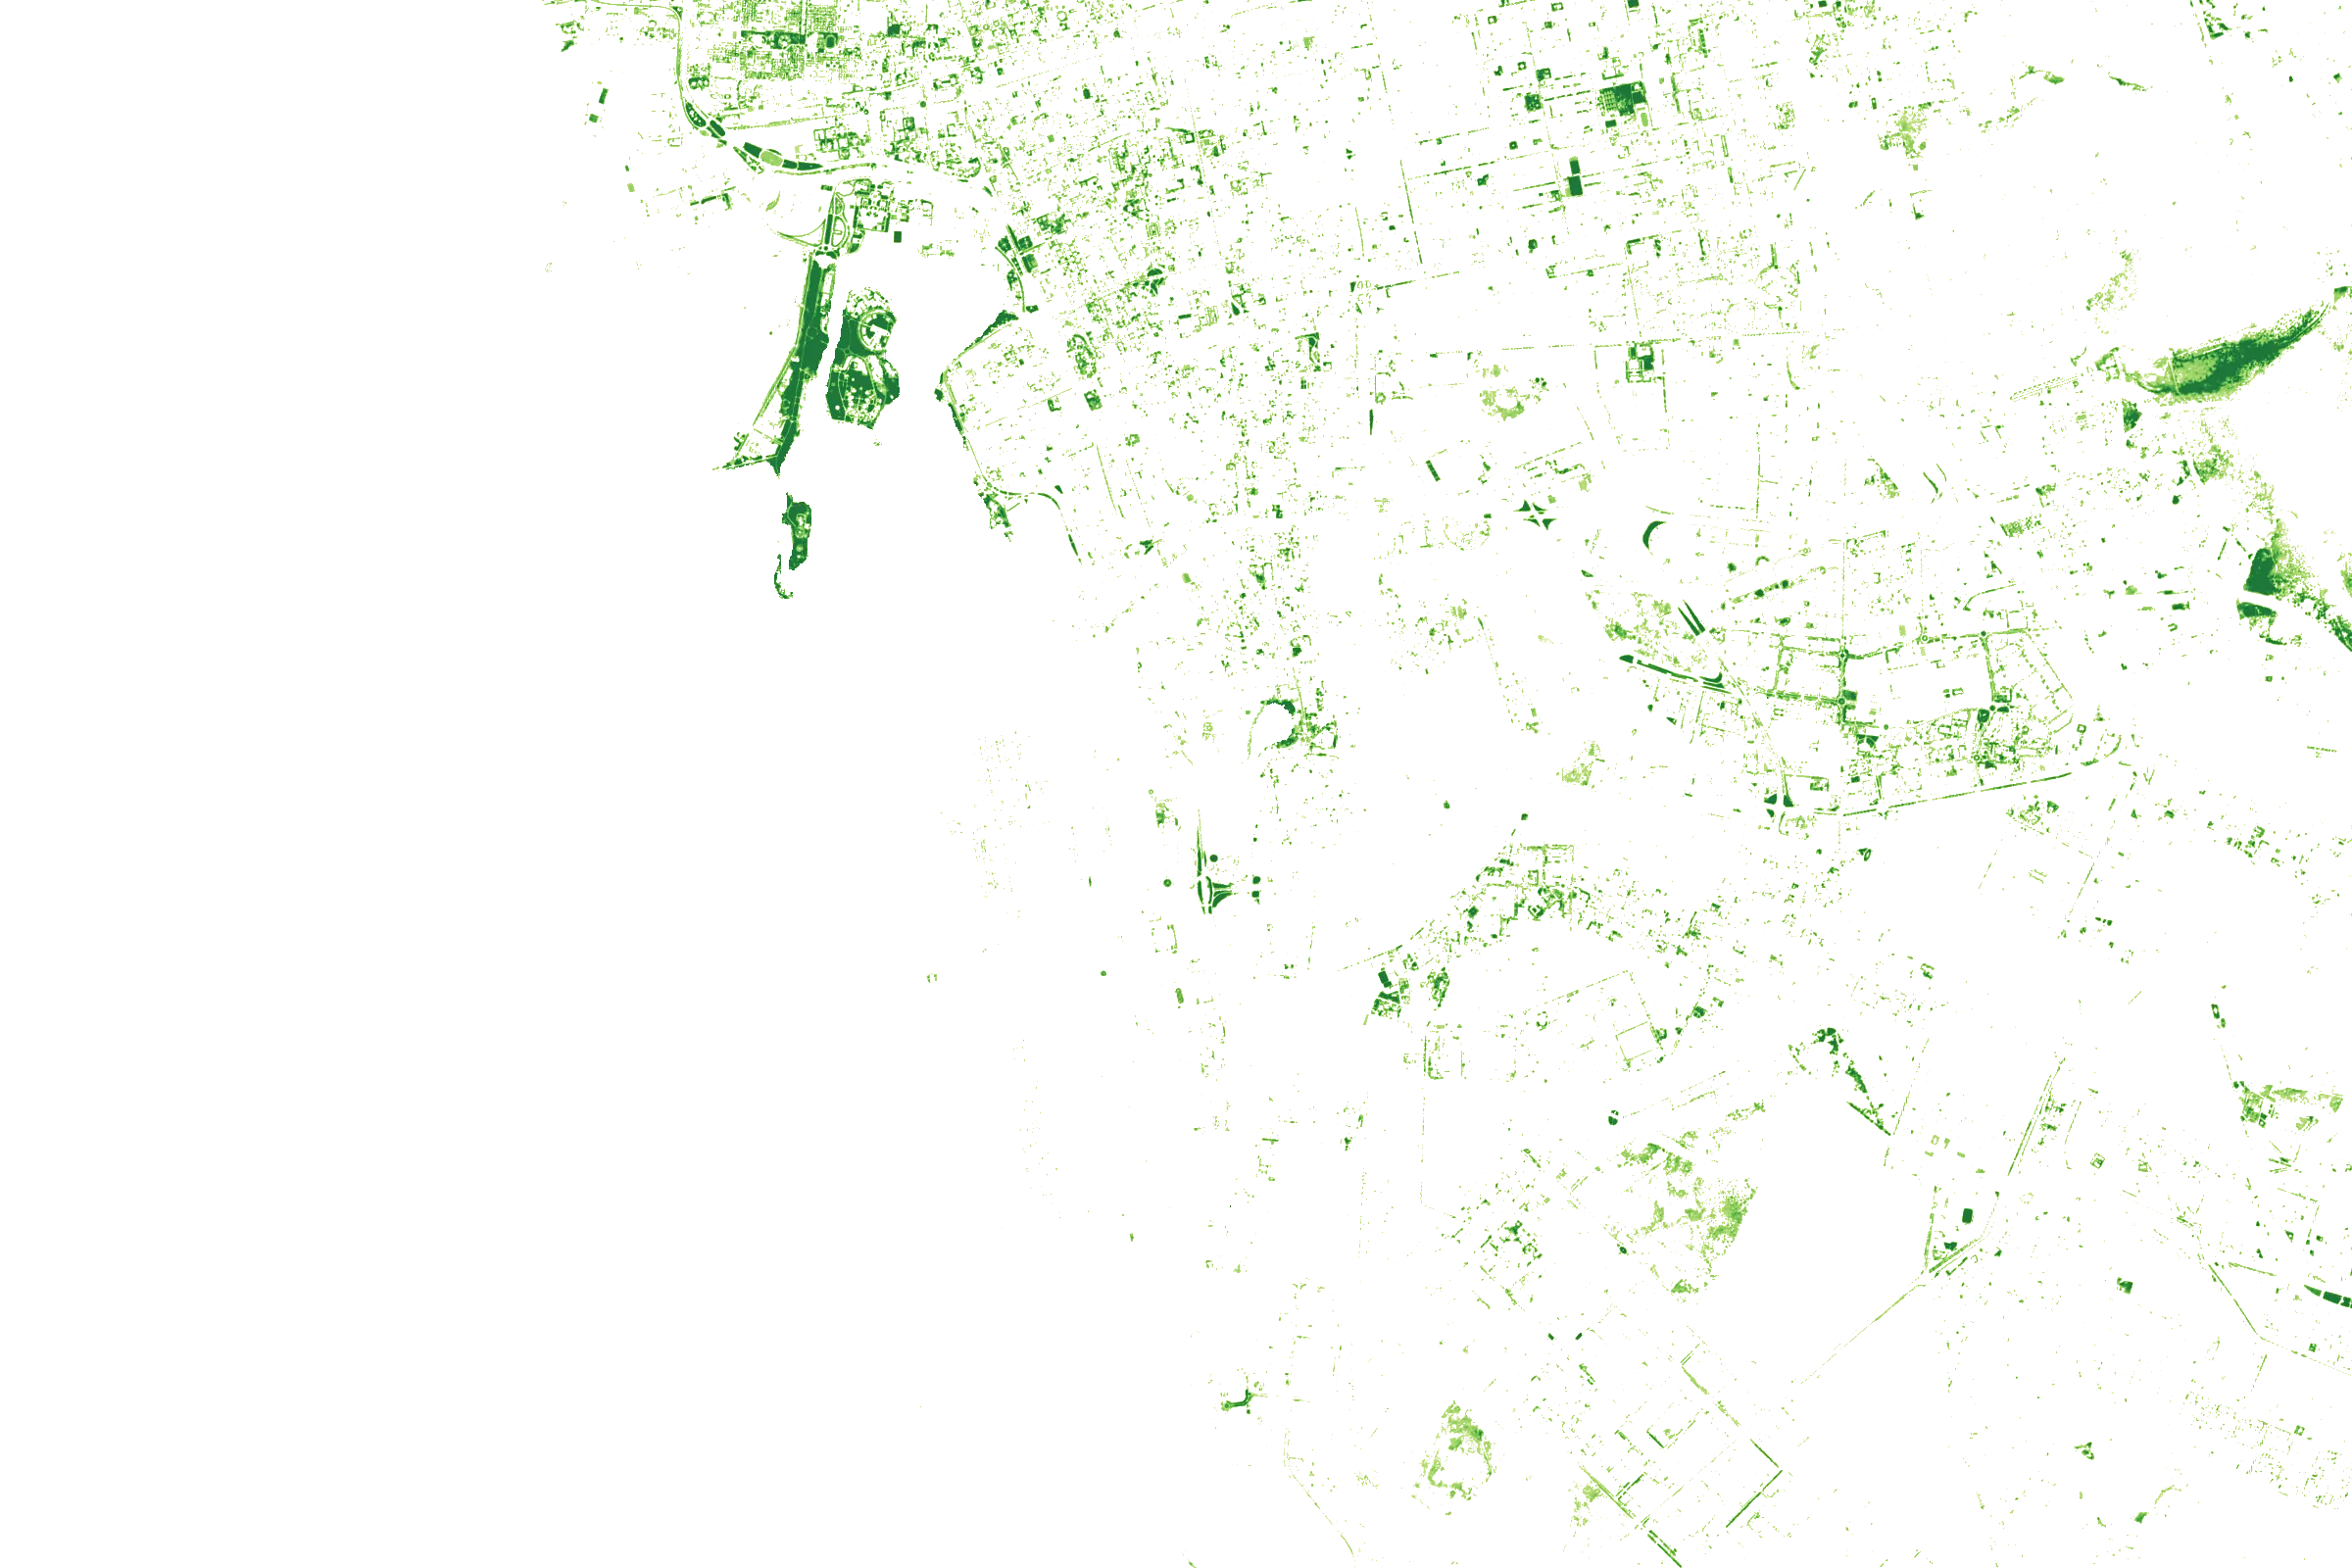
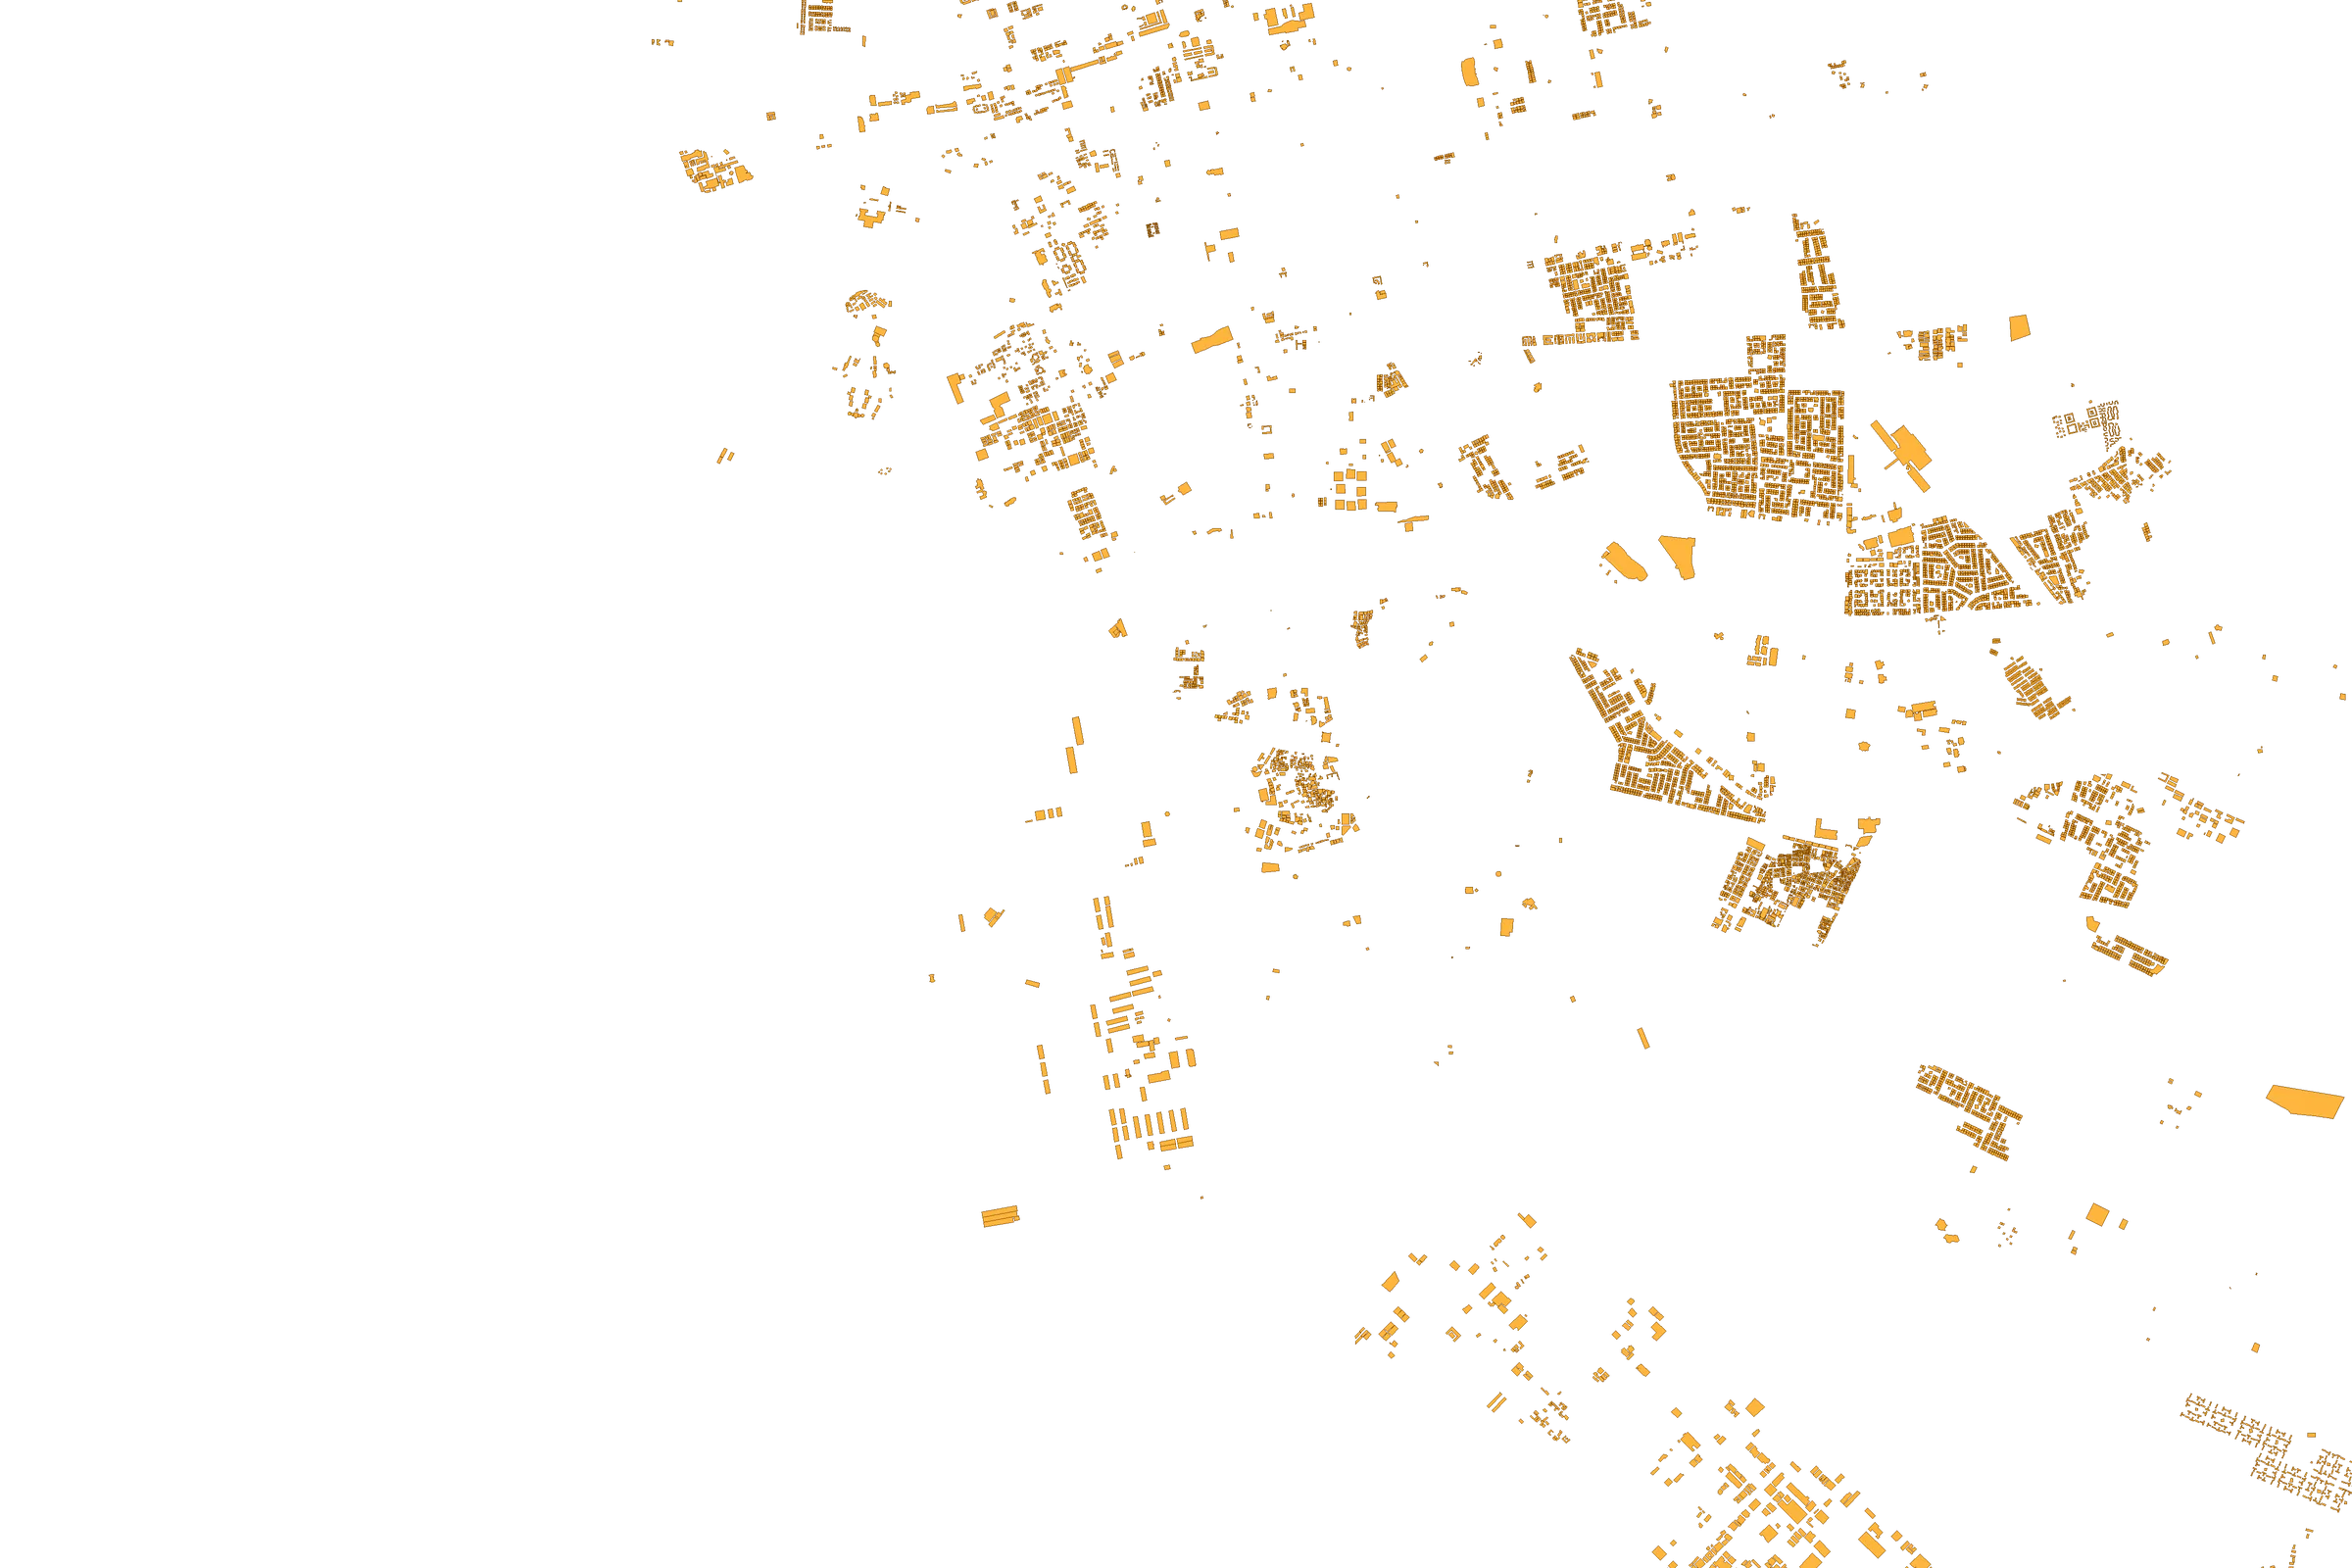
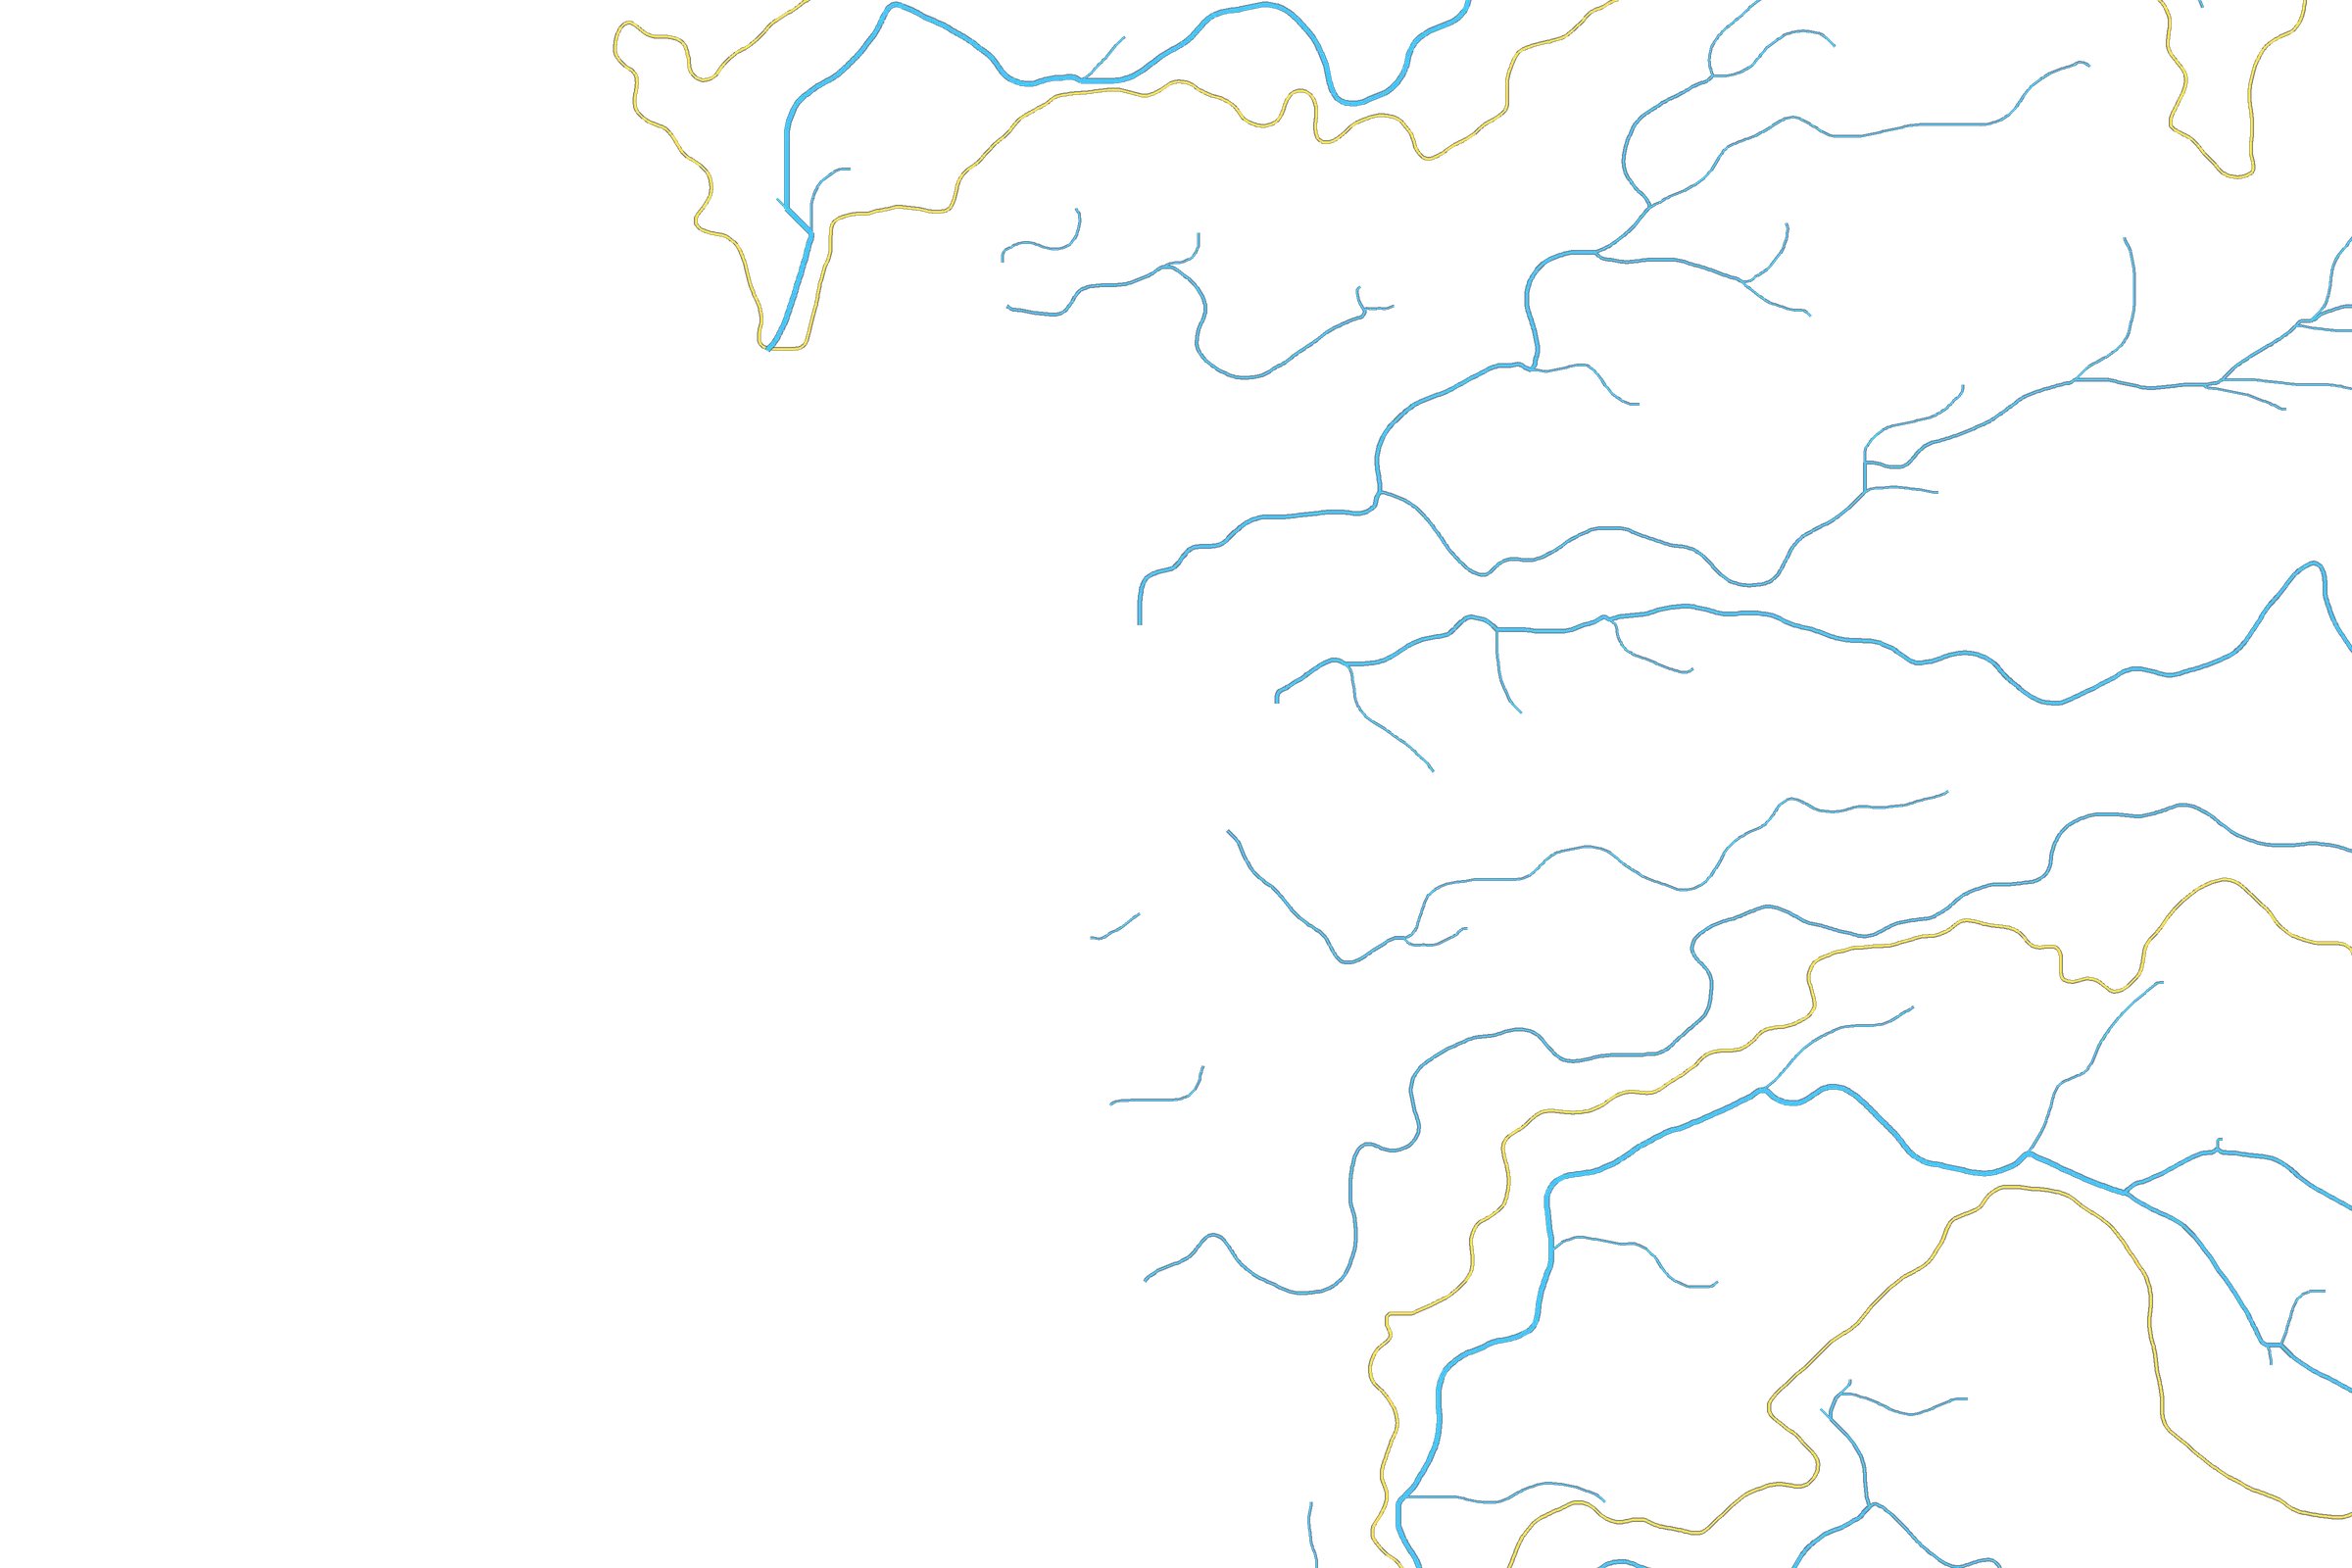
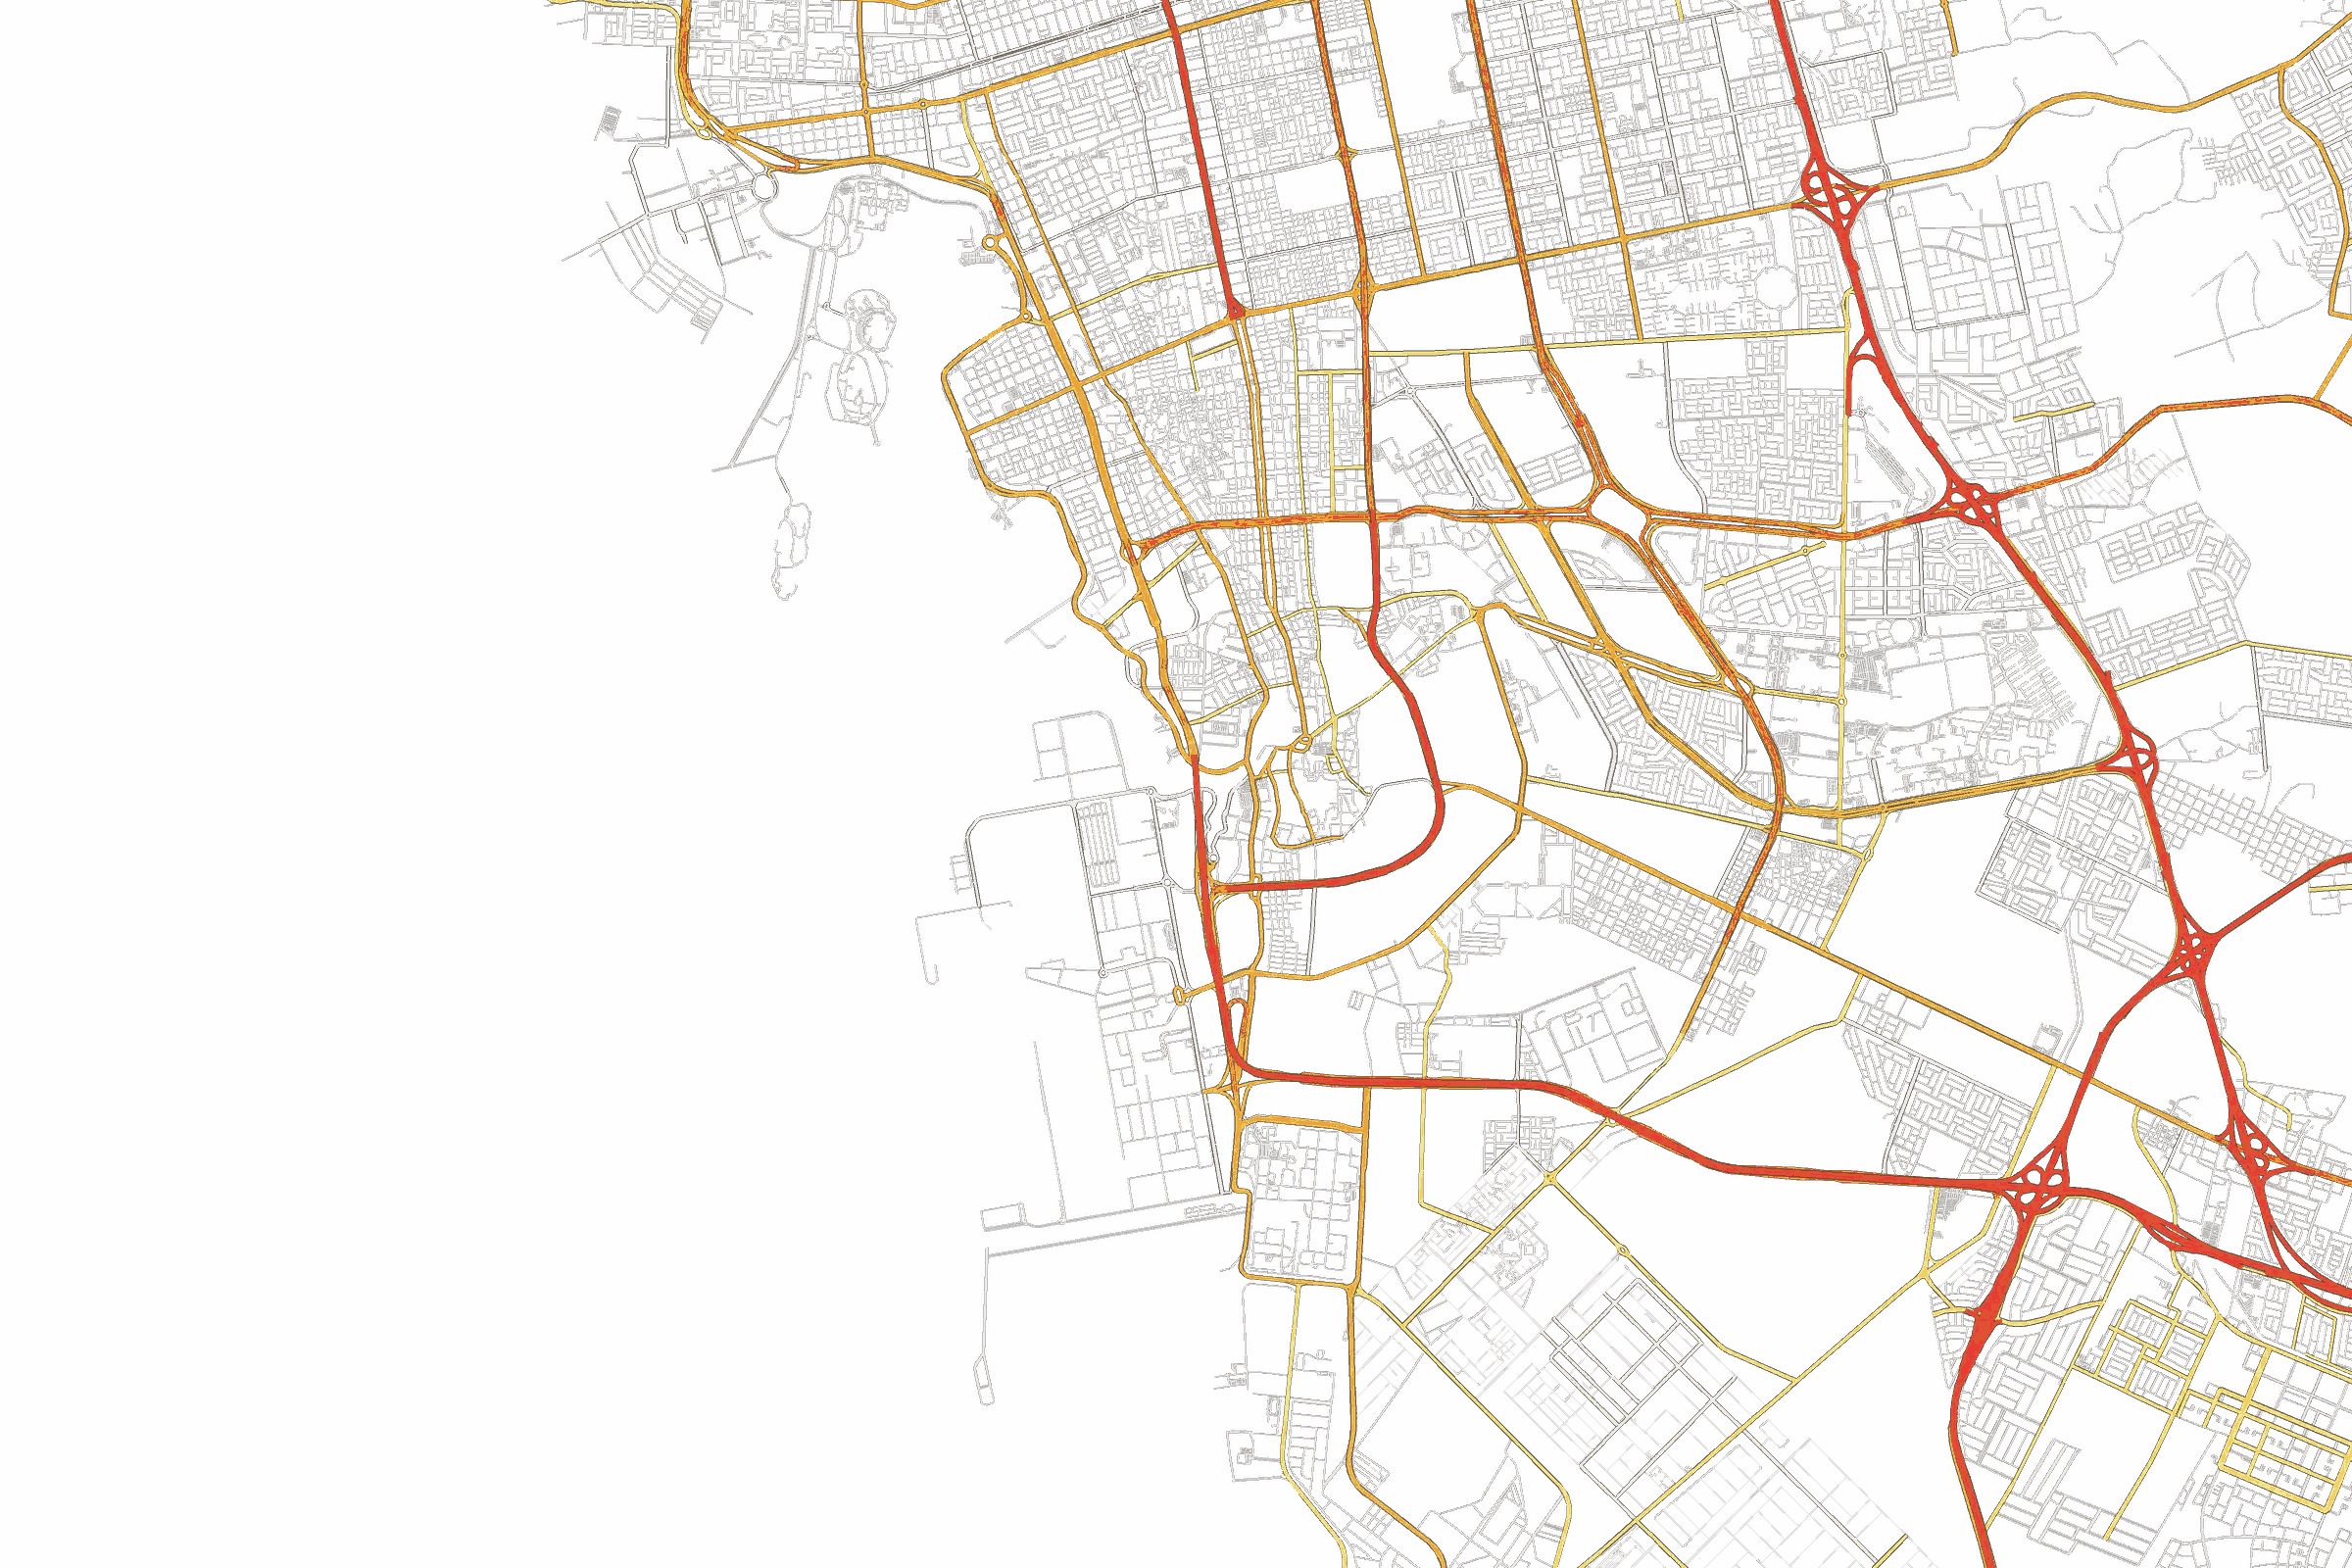
Map layers
Satellite image
Road network
District names
Building footprints
Drainage paths and catchments
Vegetation (NDVI)
Figures of the map area
| Built-up area | 150 sq km |
| Vegetated area | 16.4 sq km |
| Road length | 3,282 km |
| Buildings mapped | 12,016 |
Geospatial analysis and GIS services
Geodatabase design and build
We design the structure of the geodatabase (layers, fields, domains and relationships) on a defined coordinate system, load it from survey data, drawings and existing records, and check its topology before delivery.
GDBGPKGSHPSpatial analysis
Analysis of the spatial relationships between layers, distances and zones of influence, road and utility networks and terrain, to support planning and design decisions.
Analysis mapsTablesHydrological analysis
Watershed delineation, drainage network and flow-path analysis from terrain models.
Catchment mapsFlow pathsSatellite image analysis
Land cover classification, vegetation indices and change between two dates, from satellite images of the study area.
Land cover mapsChange mapsData conversion and digitizing
Legacy drawings, scanned maps and spreadsheets converted into clean, consistent GIS layers, and existing layers and base maps brought up to date.
LayersAttribute tablesCartography and map production
Base maps and thematic maps, printed and digital: graduated color maps, density maps and hot spot maps, to your standards.
PDFGeoTIFFMap booksAsset inventories
Field inventories of utilities, road furniture and facilities, linked to their positions.
GeodatabaseReportsWeb maps and dashboards
Browser-based maps for teams that need to view and query the data without desktop GIS software.
Web mapDashboardIn practice
| Use | Analysis | Output |
|---|---|---|
| Choosing a site for a project | Slope and aspect, distance to roads and utilities, land use and ownership layers combined. | Site suitability map |
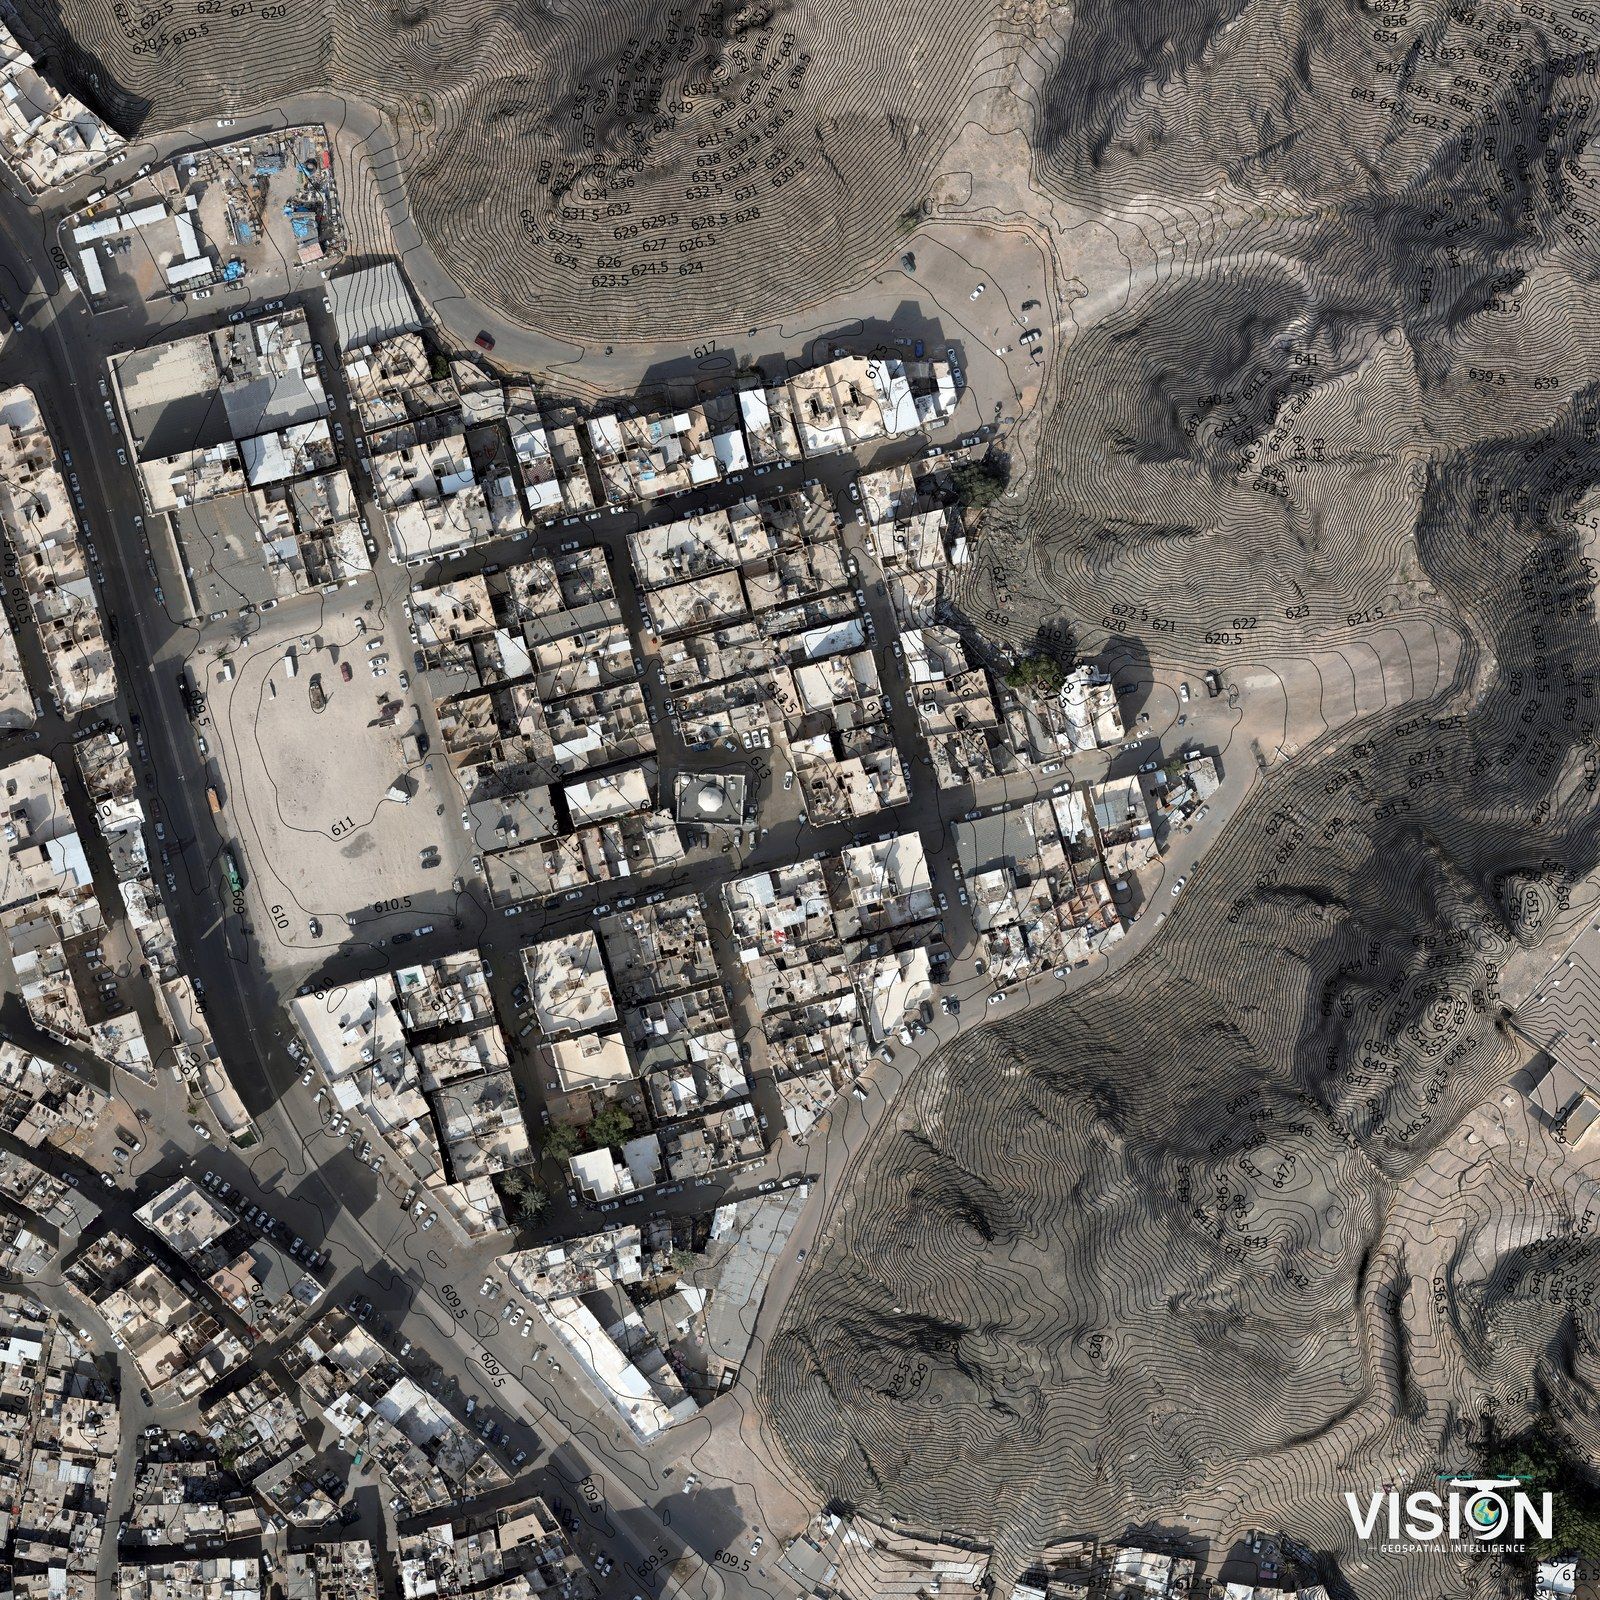
| Studying the drainage of a site | Catchments, wadi network and flow paths derived from the elevation model. | Catchment and drainage map |
| Routing a road or utility line | Parcels, buildings and utilities that fall inside the corridor. | Map and table of affected parcels with their areas |
| Showing how a value is distributed | Data classified by district or grid cell, density and hot spot analysis. | Thematic map |
| Following change on a site | Two surveys of different dates compared. | Change map with quantities |
| Managing assets | Field inventory linked to positions in a geodatabase. | Geodatabase and web map |
What a GIS delivery includes
- The geodatabase or layers in the format and coordinate system set in the scope of work
- A data dictionary listing layers, attributes and sources
- Map outputs as PDF, and a web map where requested
- A short report on the method, sources and any data limitations
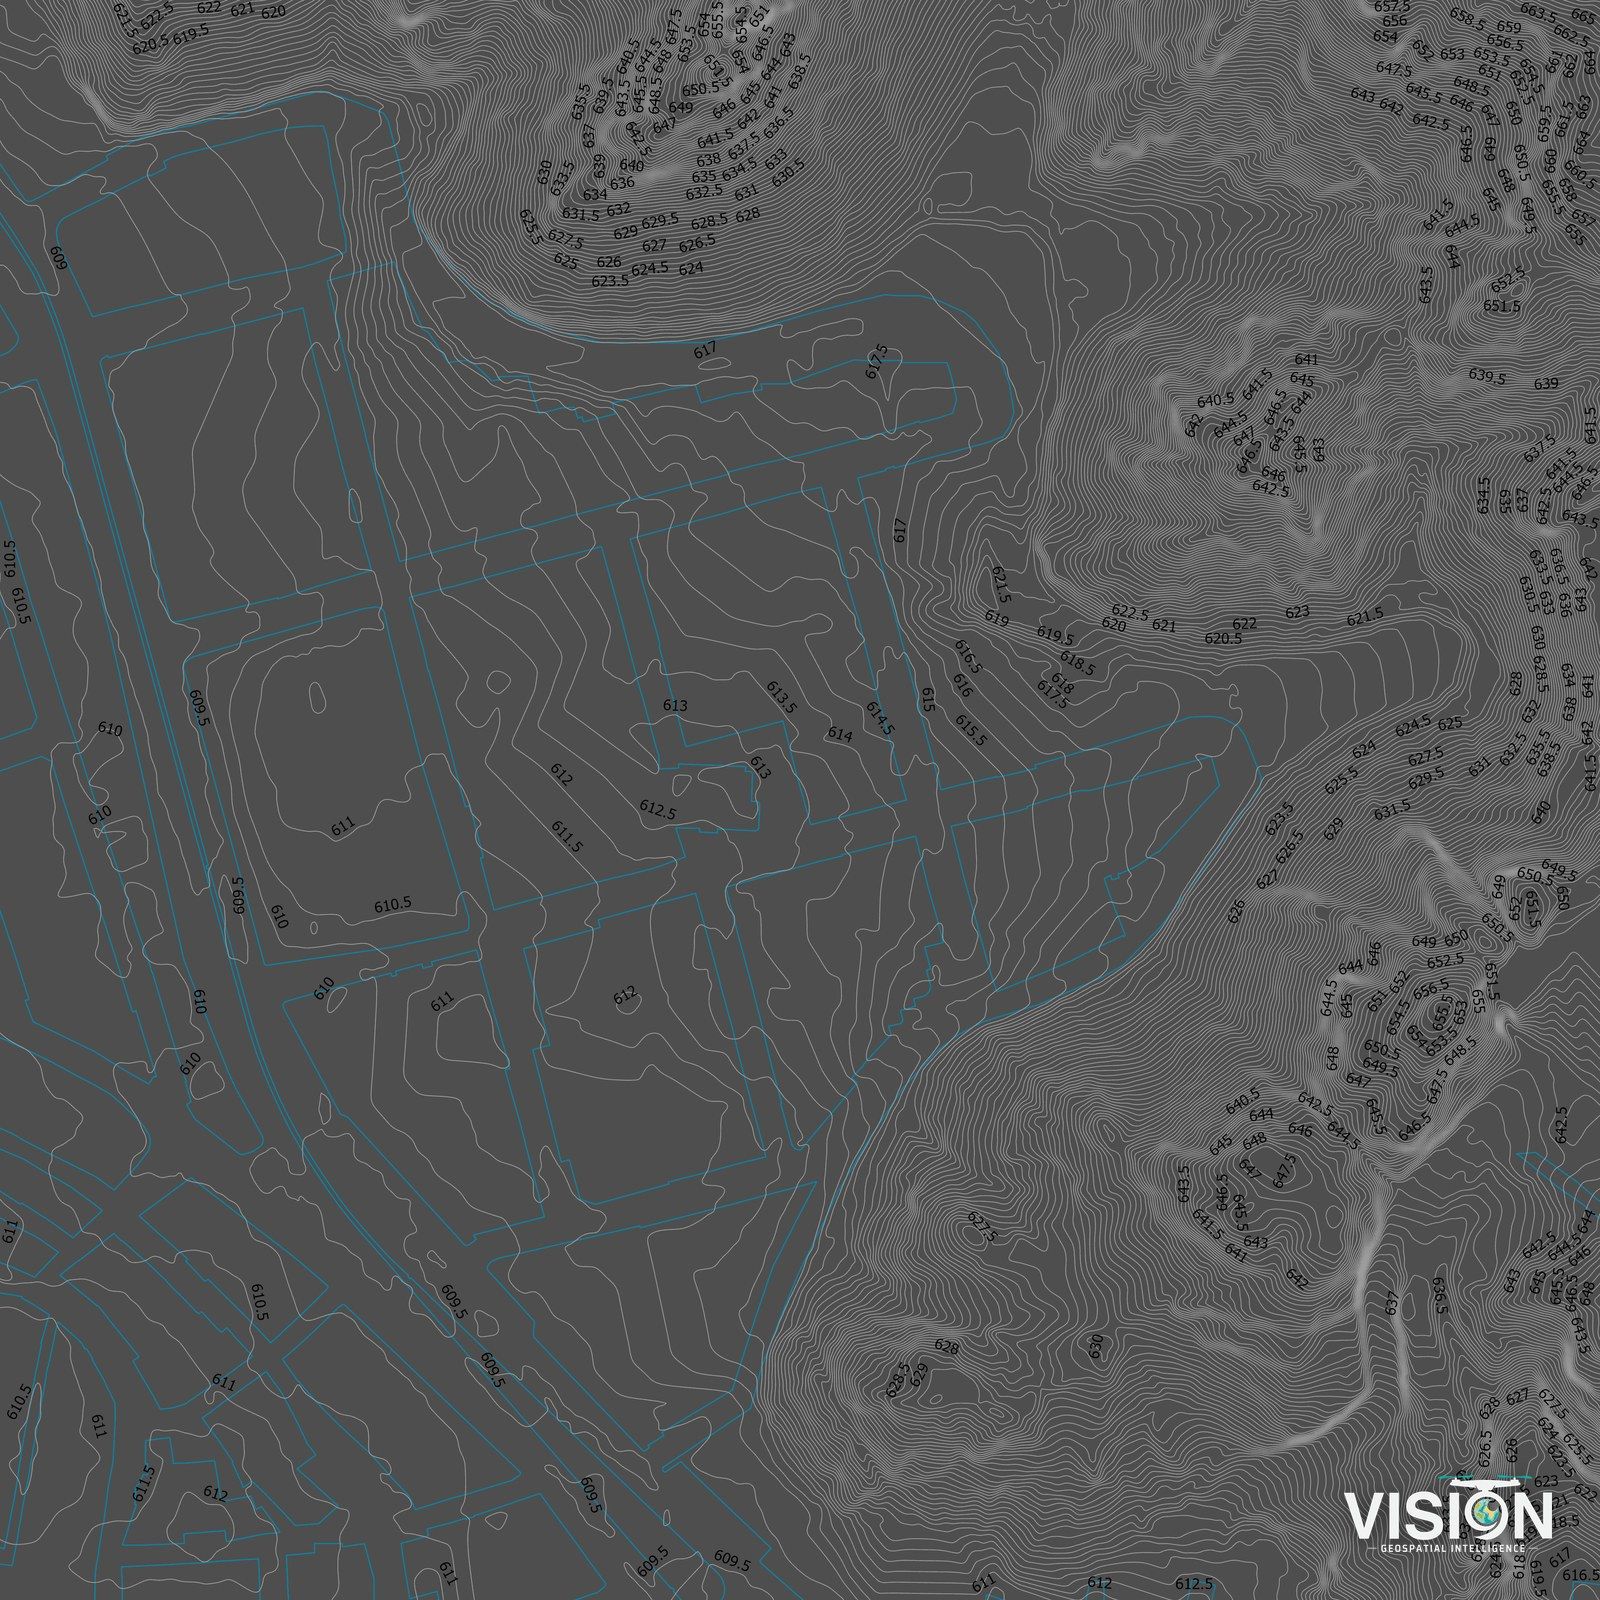
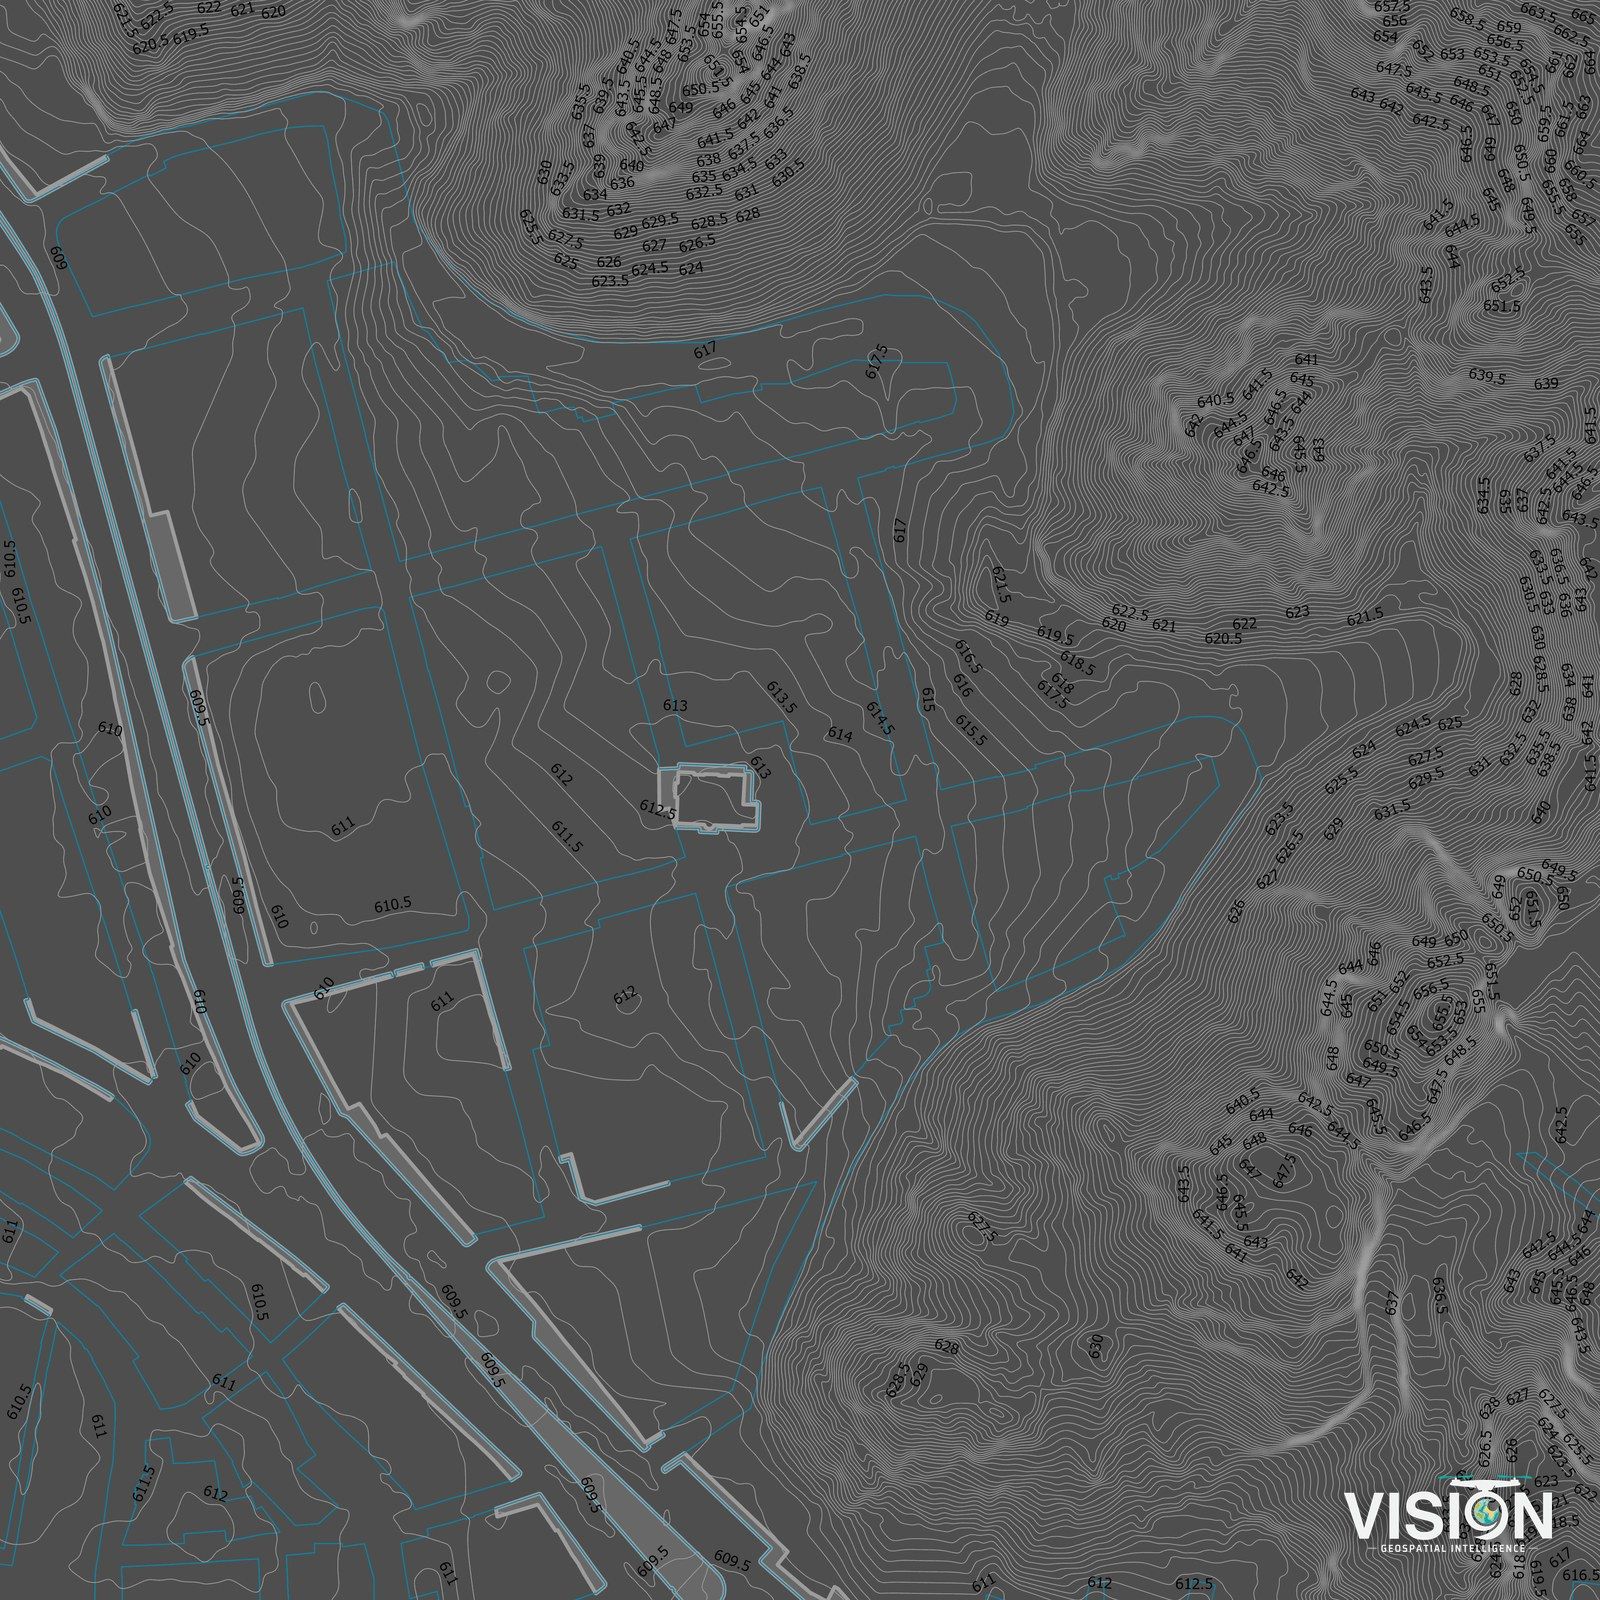
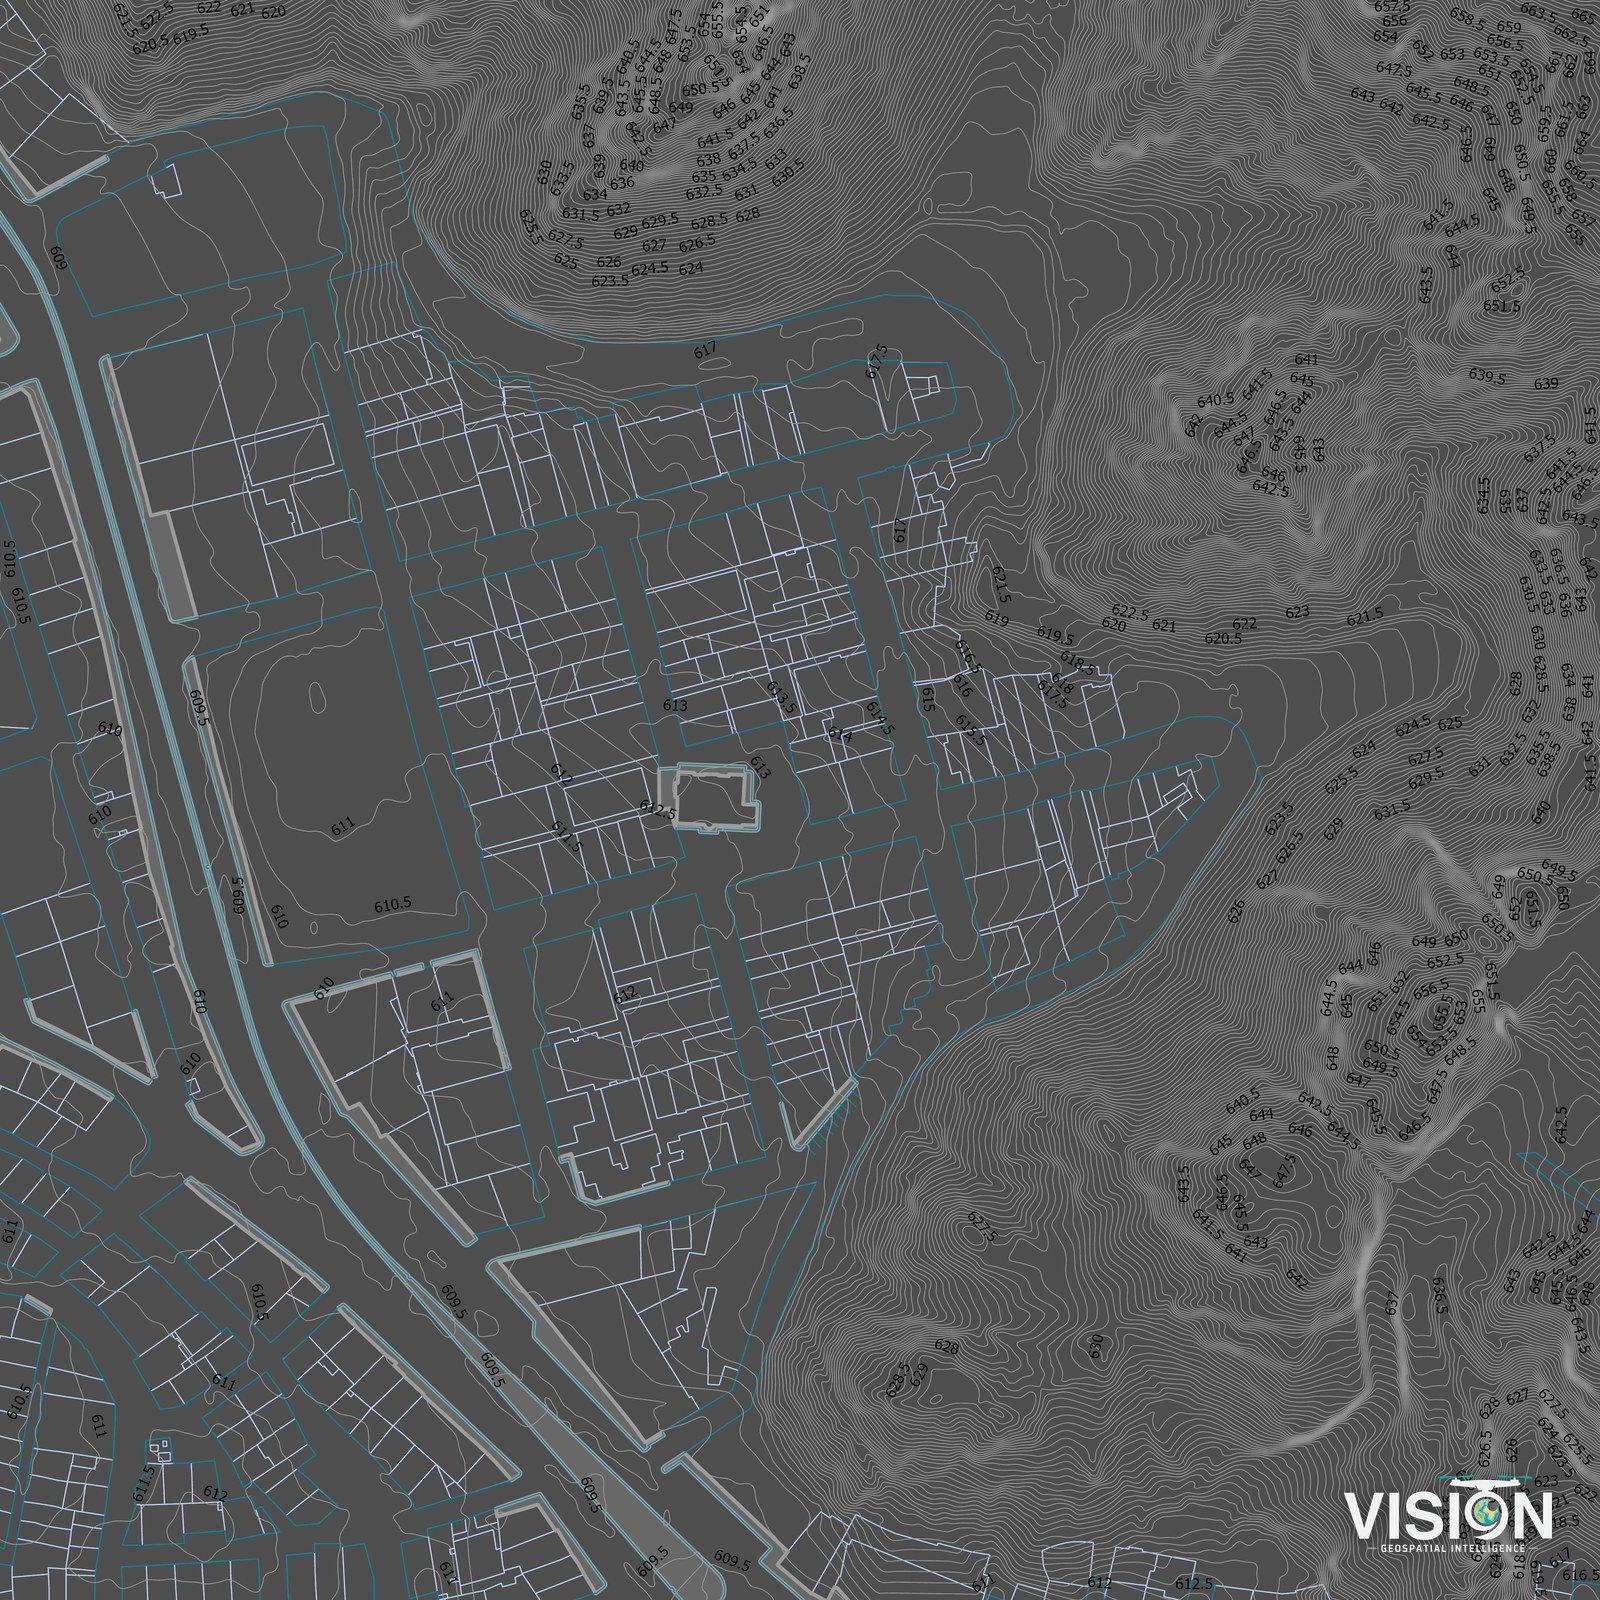
From the orthophoto to the cadastral drawing
Data sources
Survey data
Orthophotos, elevation models, point clouds and field observations from our own fieldwork, in a known coordinate system.
Your records
Existing drawings, previous surveys, asset registers and spreadsheets, checked and converted.
Public datasets
Base maps, administrative boundaries and open data, used where they add context, with their sources recorded.
How we work
Collect
Survey data, drawings, records and imagery gathered for the study area.
Build
Layers, attributes and the coordinate system set up in a geodatabase.
Analyze
Spatial, terrain and drainage analysis for the question at hand.
Map and deliver
Maps, layers and findings compatible with the client's software and requirements.